Dashboards
Using dashboards, you can easily interact with your system, opening data collections (timed and manual), monitoring event notifications and process states, and viewing data within a number of configurable charts.
There are different types of dashboards, each serving a specific purpose:
-
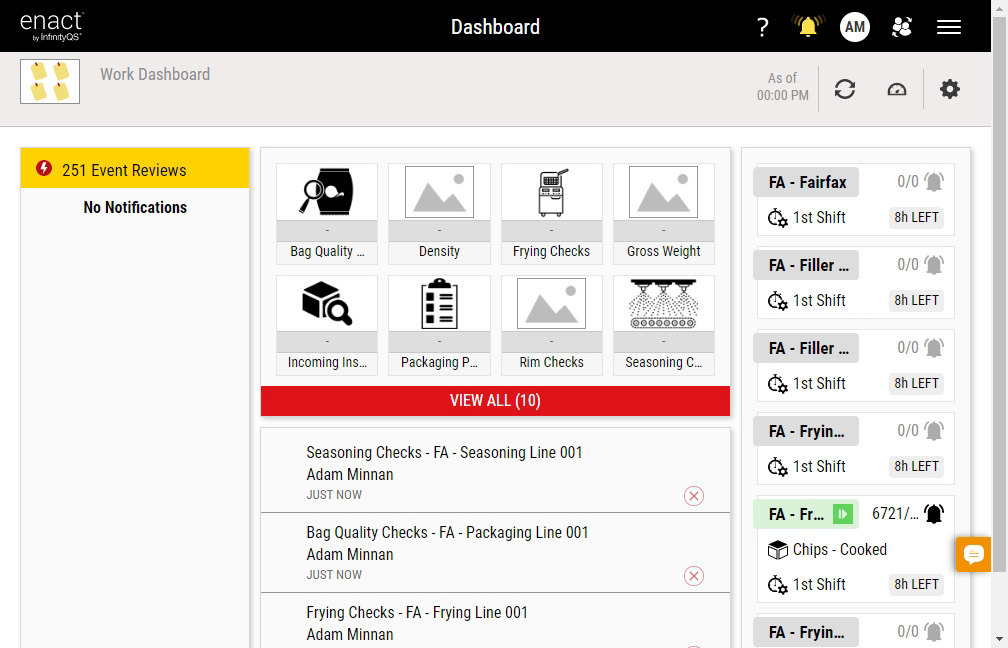
Work Dashboard. Assigned to individual users by the system administrator, the layout and content of the work dashboard is fixed and unchangeable, and automatically contains the four tiles that every user would need to see: the Notifications tile, the Data Collection tile, the Process Information tile, and a special Finished Item tile that displays data collected by the current user. The work dashboard can be linked from and to raw and aggregate dashboard as well as link to other dashboards or URLs. For more information, please see Managing Work Dashboards.
-
Run Chart Dashboard. Based on process responsibility (set by user; for more information, please see Selecting My Processes), this dashboard displays run charts for process-part-feature data streams. The run charts are plotted in chronological order, relative to specification limits, providing an overview of your processes and allowing you to quickly identify trends in your data streams. For more information, please see Managing Run Chart Dashboards.

-
Raw Dashboard. The layout and content of the raw dashboard is configurable, allowing you to select, place, and size individual raw data tiles, including the following tiles: Box & Whisker, Pareto, Data Summary,

-
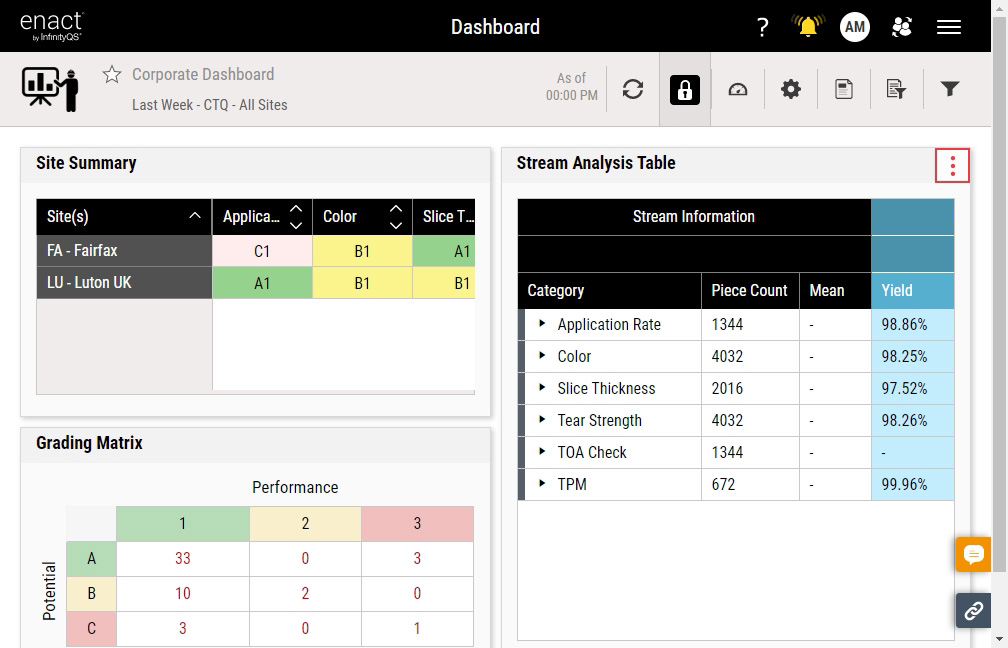
Aggregated Dashboard. The layout and content of the aggregated dashboard is configurable, allowing you to select, place, and size individual aggregated data tiles, including the following tiles: Stream Analysis Table, 2D Chart, Grading Matrix, Site Summary, Bubble Chart, Stream Overview Report, Compliance Summary, Lot Report. For more information, please see Managing Dashboards.
Enact derives the Capability Ratio rollups across multiple Part-Process-Feature (PPF) streams from the weighted proportional fallout of each stream residing in a given rollup row. Because of this, different specification limits among the PPF streams do not cause an issue. When determining the capability ratio, Enact does not include PPF streams without specification limits in the fallout intermediate calculation, since Enact can't calculate the fallout for that PPF. For unilateral specification limits, Enact will only consider the fallouts for the side where specification limits exist.
 How do aggregated dashboards work?
Aggregated dashboards are built for larger sets of historical data, which Enact aggregates periodically in the background. Current data has not yet been aggregated, and therefore will not yet appear on aggregated dashboards. To view current (or "live") data, use raw dashboards. To understand how and when the data aggregation works, consider the following:
-
Daily Aggregation. From midnight to midnight in the process's time zone, Enact summarizes one whole day of data at a time. Enact checks for new data to aggregate every hour, so you will be able to see the previous day's data around 01:00 AM local time. When you use a dynamic or static time window or an aggregated dashboard, Enact returns data for your time window in whole-day increments. You can view one day or multiple days, but only in increments of whole days.
-
Shift Aggregation. Fifteen minutes after a shift ends, Enact summarizes the entire shift's data for each process. If you set your parameter set to By Shift | Previous Shift instead of Dynamic Time or Static Time), Enact uses the previous shift's aggregated data instead of the daily aggregation.
-
Lot Aggregation. When you set a lot's testing status to Testing - Complete, Enact immediately assembles data for the Lot Report, which disregards the parameter set's Time Window setting. For more information, please see Managing Lot Report Tiles.
-
Hourly Aggregation. Once every hour, Enact checks for previously aggregated data that's been edited, and re-aggregates the data using the edits. Enact will not re-aggregate data older than six months.
How do parameter sets for aggregated dashboards work?
You can use any parameter set for an aggregated dashboard, but it will differ from a raw dashboard, as follows:
-
Time Window. To view daily aggregated records, set the Time Window using Dynamic Time or Static Time. As stated above, Enact summarizes whole days of data at a time in midnight-to-midnight increments in the process's time zone.
-
By Shift | Previous Shift. To view the previous shift's aggregated records, configure By Shift | Previous Shift. As stated above, Enact summarizes the entire previous shift's data for each process.
-
Lot. To view a completed lot's aggregated records in the Lot Report, configure By Lot. As stated above, Enact immediately assembles data for the Lot Report, which disregards the parameter set's Time Window setting. For more information, please see Managing Lot Report Tiles.
Because some parameter set fields do not apply, aggregated dashboards ignore the following parameter set fields: Hours/minutes, Shift, Lot (except for the Lot Report), and Data Collection Type.
Why does my raw data differ from my aggregated data?
You may notice discrepancies between the data in your raw dashboards and your aggregated dashboards. This is entirely expected, given the nature and purpose of the two dashboard types, and you can identify one or more of the reasons for the differences in the following list:
-
Non-Aligned Time Window
Unless you set Time Window to Previous Shift, Enact only displays aggregated data in midnight-to-midnight time windows, so you would need to configure the parameter set with a midnight-to-midnight time window as well.
-
Lot Report Tile
The Lot Report tile displays data for the selected lot in its entirety, regardless of the time window. For more information, please see Managing Lot Report Tiles.
-
Non-Aggregated Filters
Enact cannot filter aggregated data by data collection type, code, shift (unless you set Time Window to Previous Shift), or lot (unless you're using the Lot Report). You can only configure parameter sets or filters using these descriptors for raw data.
-
Tile Types
There are tiles that only display certain types of data. For example, the Box & Whisker tile does not display attribute (defect or defective) data or checklist data. For more information about specific tiles and their contents, please see the tile links in Adding Tiles.
-
Changing Manufacturing Limits
When you change manufacturing limits, raw data will immediately use the updated limits, but aggregated data will not be re-aggregated, instead continuing to use the old limits. Consider the following examples:
-
Increased specification tolerance after aggregation: Capability indexes (Cp, Pp, etc.) will increase on raw data only.
-
Added reasonable limits after aggregation: Subgroup count may decrease and SD(ST) and SD(LT) may decrease on raw data only, improving capability indexes.
-
Added process-specific limits: Override non-specific limits on raw data only.
To troubleshoot, do the following:
-
For the given data stream, verify the change history of the manufacturing limits. For more information, please see Managing Change History (Manufacturing Limits). If the manufacturing limits were changed during the selected timeframe, you will see discrepancies between the raw data and aggregated data.
-
To identify unreasonable values, check for different measurement or piece counts.
-
Keep in mind that Enact applies reasonable limits to newly created manufacturing limits automatically, using a multiplier to determine the setting. For more information, please see Limits Tab in Configuring Global Settings.
-
-
Changing Process Time Zones
While rare, it is possible that a changed process time zone could cause discrepancies, since aggregated data always uses midnight-to-midnight time windows, which may not align with the raw data time window. To troubleshoot, you can examine the Last Updated data field in the Processes landing page. For more information, please see Managing Processes.
-
Software Updates
As InfinityQS introduces new functionality to Enact, the scope of aggregation can change and expand, which means new aggregation functionality would not be available in past data. For more information, please see What's New in Enact.
-