Managing Lot Report Tiles
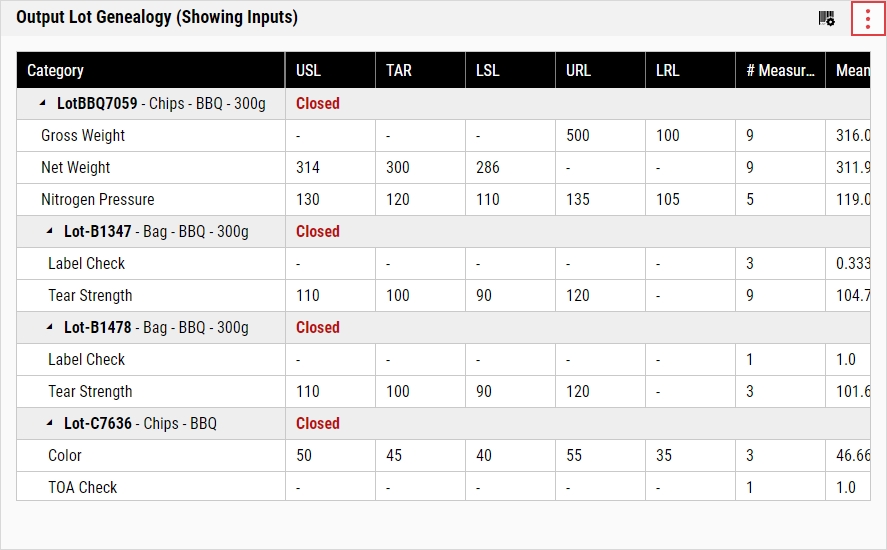
The Lot Report tile displays a set of statistics for one lot at a time, as well as, if available and enabled, statistics for component lots of the selected lot. The statistics are organized by feature or feature tag selected in the current parameter set or dashboard filters, which allows you to review the overall quality of a batch before accepting or rejecting it. To view the statistics, the lot must be aggregated (Lot Testing = Completed and/or Lot Status = Closed) and it must contain subgroup data. If the lot is not aggregated, Enact displays the lot name, part, and current lot status, along with the message Lot is not yet complete. If the lot is aggregated but doesn't contain subgroups or you have excluded the features in the current parameter set or dashboard filters, Enact displays message No data collected.
When you select the parameter set on the dashboard, it will affect the contents of this tile.
-
In the aggregated dashboard toolbar, select Add Tile and then select the Lot Report tile.
-
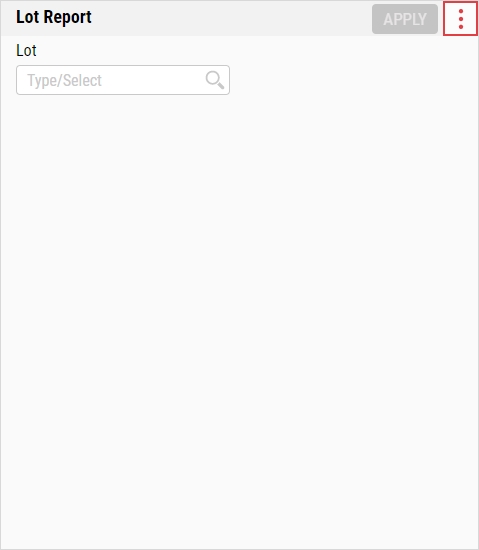
In the Lot drop-down list, select the desired lot. Hint

Enact filters the available lots by the parts, part tags, lots, lot tags, and lot statuses selected in the current parameter set or dashboard filters.
-
To enable lot genealogy, allowing you to trace finished good components, component origins, and poor quality sources, as well as select lots for recalls, activate the Include lot genealogy slider, and then do the following:
-
To view all inputs for each output, select Output.
To view all outputs for each input, select Input.
-
In the Levels drop-down list, select the desired number of genealogy levels (maximum of 7).
-
- Select Apply.
-
In the Lot Report tile, you can do the following:
- Selecting Parameter Sets
-
Selecting Lots
Using this procedure, you will select a new lot in an existing Lot Report tile.
- In the Lot Report tile, select Select Lot.
-
In the Lot drop-down list, select the desired lot. Hint
Enact filters the available lots by the parts, part tags, lots, lot tags, and lot statuses selected in the current parameter set or dashboard filters.
-
To enable lot genealogy, allowing you to trace finished good components, component origins, and poor quality sources, as well as select lots for recalls, activate the Include lot genealogy slider, and then do the following:
-
To view all inputs for each output, select Output.
To view all outputs for each input, select Input.
-
In the Levels drop-down list, select the desired number of genealogy levels (maximum of 7).
-
- Select Apply.
-
Configuring Columns
Using this procedure, you will control the columns that Enact displays in the Lot Report tile.
-
In the Lot Report tile, select More and then select Configure Columns.
-
In the Configure Columns dialog box, select the desired columns.
Columns
- USL. Highest value in which a given service or product may perform.
- TAR. Desired process centering.
- LSL. Lowest value in which a given service or product must perform.
- URL. Highest acceptable value, used to detect data entry errors such as transposed numbers. Also known as the Upper Reasonable Limit.
- LRL. Lowest acceptable value, used to detect data entry errors such as transposed numbers. Also known as the Lower Reasonable Limit.
- # Measurements. Total number of measurement values.
-
Mean. Arithmetic average of a given data set, where N represents the number of values in the data set.
Formula -
SD (LT). Variation representing the average deviation of values from their mean, often called the RMS (root mean square) method of calculating sigma.
Formula - Minimum. Smallest value entered for a feature found in the parameter set.
- Maximum. Largest value entered for a feature found in the parameter set.
- # Defects. Number of defects, weighted by code weight.
- % Defects. Percent of defects.
- # Defectives. Number of defectives, weighted by code weight.
- % Defectives. Percent of defectives.
- # OOS. Number of measured values outside the specification limits.
- % OOS. Percent of measured values outside the specification limits.
- % Yield. Percentage of potential good pieces from total pieces measured based on short-term standard deviation.
- # Manufacturing Limit Events. Manufacturing limit event count in the dashboard's selected parameter set.
- # Statistical Events. Statistical event count based on the established statistical rules. For more information, please see Statistical Rules.
- # OOR (Fallouts). Number of tests that fell outside the reasonable limits.
-
Pp. Ratio of the process variability (six sigma) with the width of the specification limits (total tolerance). The standard deviation (sigma) is calculated using the root mean square method (RMS).
Formula -
Ppk. Capability ratio that is adjusted for non-centered processes, using long-term standard deviation, comparing the specification limit spread to the spread of the variation of the data stream. Ppk is equal to the smaller of Ppu or Ppl.
Formula -
Ppm. Variation between the process average and target value as well as the process standard deviation, where T is the target value. The standard deviation is calculated using the root mean square (RMS) method.
Formula - Start Time. Timestamp for the first collected value.
- End Time. Timestamp for the last collected value.
- Select Done.
-
-
Downloading Tiles
Using this procedure, you will download the contents of the Lot Report tile into a Microsoft Excel spreadsheet.
By downloading the Lot Report tile data, you can build a Certificate of Analysis (CoA) document using an external application.
- In the Lot Report tile, select More and then select Download.
- In the Download dialog box, select Save, and in the Save As dialog box, browse to the desired save location on the computer (for example, the Windows Downloads folder).
-
In Microsoft Excel, open the saved file and examine the contents of the downloaded Lot Report tile. Microsoft Excel displays the contents expanded or collapsed as it was in the Lot Report tile.
-
Removing Tiles
Using this procedure, you will remove the Lot Report tile.
-
In the unlocked dashboard, locate the Lot Report tile.
For more information, please see Locking/Unlocking Dashboards.
- In the Lot Report tile, select More and then select Remove Tile.
- Select Save.
-


