Managing Dashboards
Using dashboards, you can easily interact with your system, opening data collections (timed and manual), monitoring event notifications and process states, and viewing data within a number of configurable charts. Both raw dashboards and aggregated dashboards are configurable, allowing you to select, place and size individual tiles. The available tiles that you can select depend on the dashboard type (raw or aggregated). You can also link from raw or aggregated dashboards to and from your work dashboard.
For more information about the tiles on dashboards, please see the following:
-
 Raw Dashboards
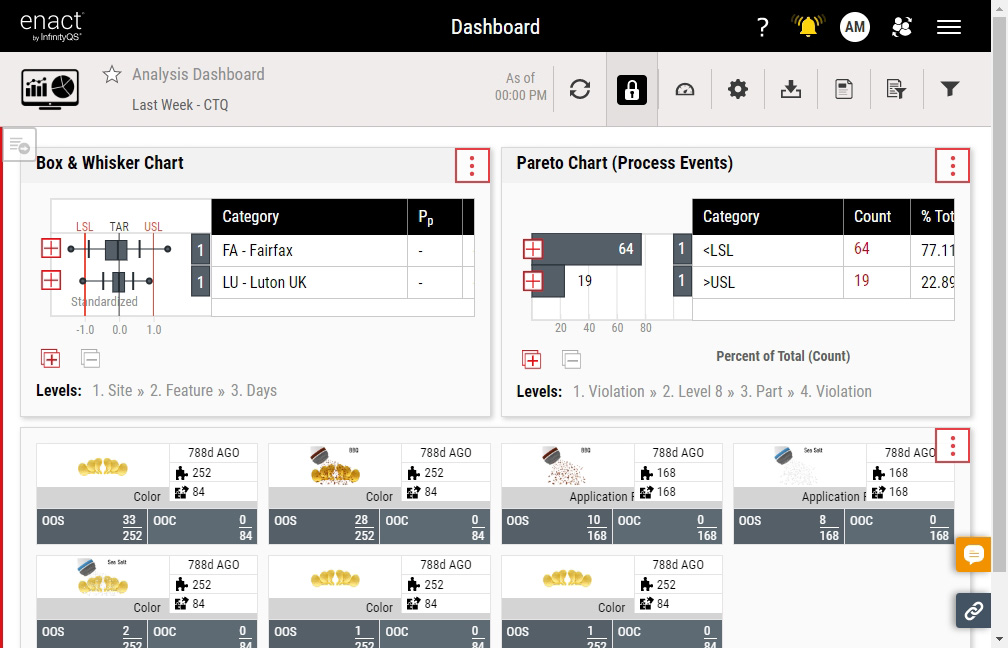
- Box & Whisker. The Box & Whisker tile displays the subgroup sets or data distributions across time, similar to a histogram. However, instead of displaying data in a front view (as you would with a histogram), the Box & Whisker tile displays data in a top view, with three quartiles, the fifth and ninety-fifth percentiles, and the minimum and maximum points, often referred to as outliers. For more information, please see Managing Box & Whisker Tiles.
- Pareto. The Pareto tile displays the occurrences of subgroup data, collected data or process events on a bar chart, most frequent to least frequent, which you can further organise into categories. For example, you can organise data by event code, and further organise the data by process. For more information, please see Managing Pareto Tiles.
- Data Summary. The Data Summary tile displays the details about variable features, including count, yield, and when data from the selected levels was last added. For more information, please see Managing Data Summary Tiles.
- Data Collection. The Data Collection tile displays the data collections the current user can use, based on Access Level (set by administrator; for more information, please see Editing Users) and process responsibility (set by user; for more information, please see Selecting My Processes). When you add requirements to the data collection (for more information, please see Creating Data Collection Requirements), which establishes a timing window for the collection to occur, Enact only displays the data collection with timer during this window, hiding the data collection without timer. Enact always displays the data collection without timer in the maximised View All page (for more information, please see Managing Dashboards). For more information, please see Managing Data Collection Tiles (Raw Dashboards).
- Notifications. The Notifications tile displays the event notifications assigned to you, including missed data collections, manufacturing limit violations (net content control and specification limit) or statistical violations. For more information, please see Managing Notifications Tiles (Raw Dashboards).
- Stream Summary. The Stream Summary tile displays the capsule views of part-process-feature data streams, prioritising data streams with out-of-specification pieces and out-of-control subgroups, in that order. From the Stream Summary sub tiles, which represent the individual data streams, you can open Histograms, Control Charts and Event Pareto Charts, allowing you to examine the data more closely. For more information, please see Managing Stream Summary Tiles.
- Compliance. The Compliance tile displays the statistics for data collections configured with collection requirements, allowing you to view requirement collection data (total, completed, late, missed, etc.) in a single table. For more information, please see Managing Compliance Tiles.
- Process Information. The Process Information tile displays the current status and allows modifications of process state, production assignments, shifts and current notifications for processes the current user can use, based on Access Level (set by administrator; for more information, please see Editing Users) and process responsibility (set by user; for more information, please see Selecting My Processes). For more information, please see Managing Process Information Tiles (Raw Dashboards).
- All Finished Items. The All Finished Items tile provides a list view with direct access to any data collection from a defined parameter set, which can then be edited and flagged based on permission sets. For more information, please see Viewing All Finished Items.
-
Aggregated Dashboards
- Stream Analysis Table. The Stream Analysis Table displays the details about historical data from features (optionally combined with processes and parts), including LSL, USL, subgroup count, yield, Cpk, Cp and Ppk, as well as other statistics. For more information, please see Managing Stream Analysis Tables.
- 2D Chart. The 2D Chart tile displays the graphical views for a selected statistic of process performance based on historical data from process-feature combinations, including Cpk, Ppk, yield (expected and potential) and mean, among others. For more information, please see Managing 2D Charts.
- Grading Matrix. The Grading Matrix tile displays a table of grading ranks for data streams (part-process-feature combinations) in the currently selected parameter set. For more information, please see Managing Grading Matrix Tiles.
- Site Summary. The Site Summary tile displays a table of grading ranks for data streams (part-process-feature combinations) in the currently selected parameter set, organised by site and feature. For more information, please see Managing Site Summary Tiles.
- Bubble Chart. The Bubble Chart tile displays three statistics for each process branch in the parameter set, summarised at a particular hierarchy level (for example, division, region, site, etc.) and plotted as a disk that expresses the values through the disk's X-Axis Statistic and Y-Axis Statistic (both required) and the disk's size (optional). Each bubble is a summary of all the processes underneath the top-level process, which is set in the Initial Grouping data field (for example, a Division-level bubble represents a summary of all processes within that division). By selecting a bubble on the Bubble Chart, you can drill down into child processes, starting at the top level (Division by default, though it depends on the Initial Grouping configuration), and going through to level 10 of the process hierarchy. For more information, please see Managing Bubble Charts.
- Stream Overview Report. The Stream Overview Report displays a compilation of different statistical metrics, including fallout metrics, capability indices and net content control values, as well as the new Composite Quality Score (CQS) metric, which combines variable and attribute violations into a single metric. For more information, please see Managing Stream Overview Reports.
- Compliance Summary. The Compliance Summary tile displays high-level compliance data across sites over time (for time-based parameter sets, by week or by month; for Previous Shift parameter sets, by shift), based on the percentage of processes at a site that meet or exceed a compliance threshold that you define. When configuring the tile, you can hide compliant sites or show all sites and highlight noncompliant sites, allowing you to identify areas that need immediate attention. For more information, please see Managing Compliance Summary Tiles.
- Lot Report. The Lot Report tile displays a set of statistics for one lot at a time, as well as, if available and enabled, statistics for component lots of the selected lot. The statistics are organised by feature or feature tag selected in the current parameter set or dashboard filters, which allows you to review the overall quality of a batch before accepting or rejecting it. To view the statistics, the lot must be aggregated (Lot Testing = Completed and/or Lot Status = Closed) and it must contain subgroup data. If the lot is not aggregated, Enact displays the lot name, part and current lot status, along with the message Lot is not yet complete. If the lot is aggregated but doesn't contain subgroups or you have excluded the features in the current parameter set or dashboard filters, Enact displays message No data collected. For more information, please see Managing Lot Report Tiles.
-
Select Access Menu and then select Dashboard.
The active dashboard is the last dashboard you used. If your administrator has not assigned a work dashboard to you and you have not interacted with any other dashboard, Enact displays the No Dashboard currently associated to display message, which also contains Select Dashboard and Create New Dashboard.
-
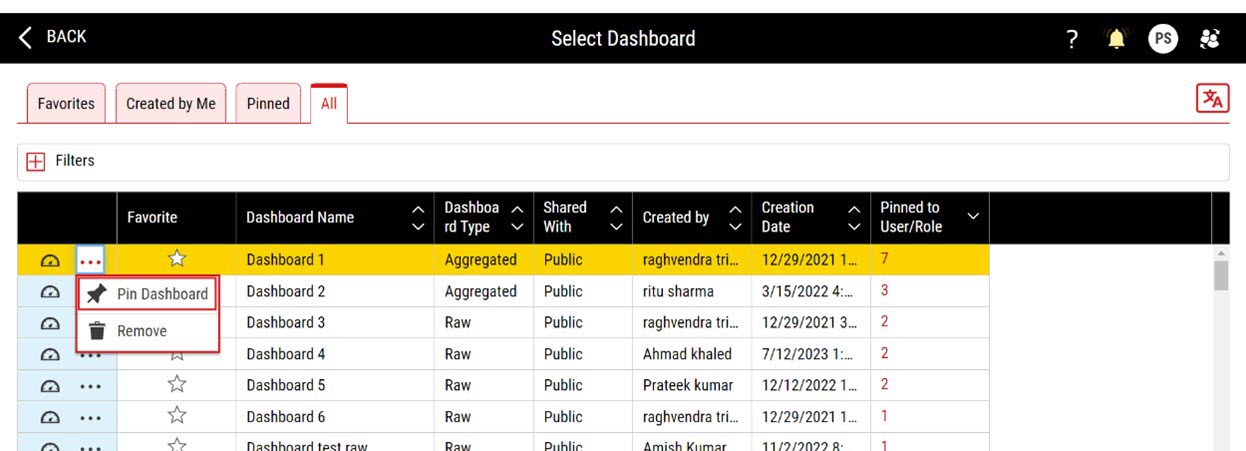
In the dashboard, select Select Dashboard and then select View All.
-
In the Select Dashboard (All) page, select Select Dashboard.
-
In the dashboard, you can do the following:

