Managing Stream Summary Tiles
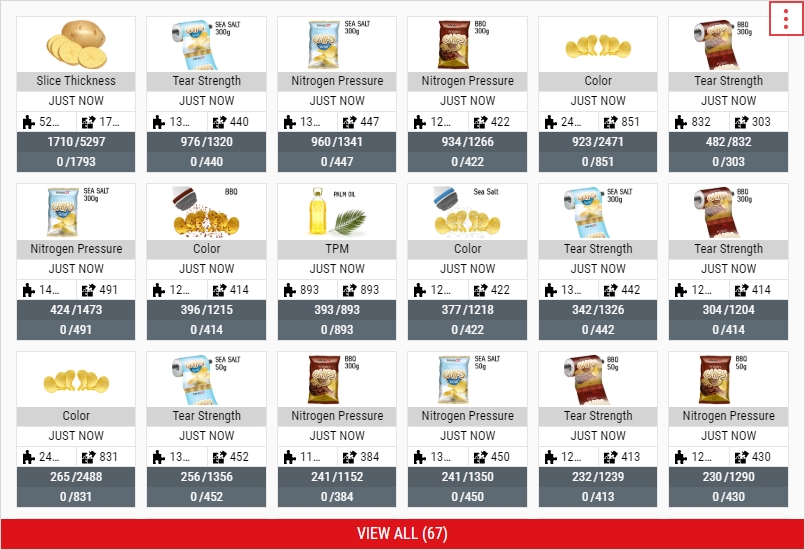
The Stream Summary tile displays the capsule views of part-process-feature data streams, prioritizing data streams with out-of-specification pieces and out-of-control subgroups, in that order. From the Stream Summary sub tiles, which represent the individual data streams, you can open Histograms, Control Charts, and Event Pareto Charts, allowing you to examine the data more closely.
When you select the parameter set on the dashboard, it will affect the contents of this tile.
- In the raw dashboard toolbar, select Add Tile and then select the Stream Summary tile.
-
In the Stream Summary tile, you can do the following:
- Selecting Parameter Sets
-
 Examining Sub Tiles
The sub tiles in the Stream Summary tile contain valuable data that you can review very quickly.
For more information, please see Flipping Individual Sub Tiles.
-
Examine the front of the desired sub tile.
Large Sub Tile
Small Sub Tile
-
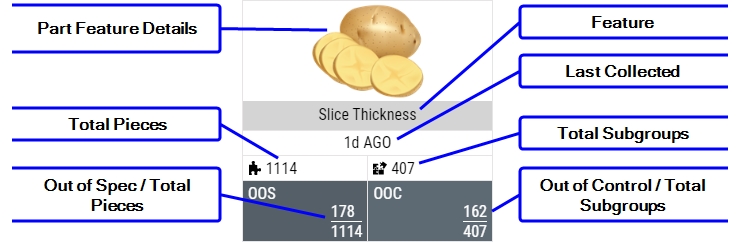
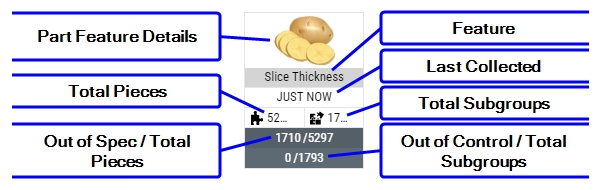
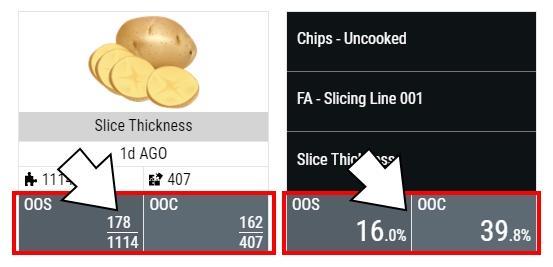
Part Feature Details. Enact displays the Part Feature Details Optional Image.
By default, Enact displays the Part Feature Details Optional Image.
- If you did not configure the Part Feature Details Optional Image, Enact displays the feature image.
- If you did not configure the feature image, Enact displays the part image.
- If you did not configure the part image, Enact displays the generic image.
- Feature. Enact displays the feature for this data stream.
- Last Collected. Enact displays the time since the last data collection for this data stream.
- Total Pieces. Enact displays the total number of pieces for this data stream.
- Total Subgroups. Enact displays the total number of subgroups for this data stream.
- Out of Spec / Total Pieces. Enact displays the total number of pieces out of specification over the total number of pieces for this data stream.
- Out of Control / Total Subgroups. Enact displays the total number of subgroups out of control over the total number of subgroups for this data stream.
-
-
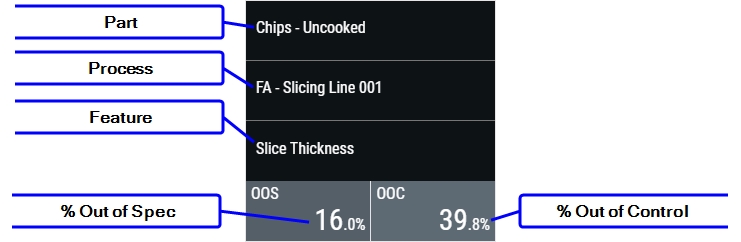
Examine the back of the desired sub tile.
Large Sub Tile
Small Sub Tile
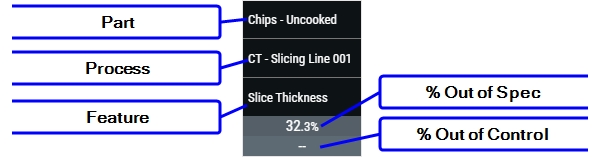
- Part. Enact displays the part for this data stream.
- Process. Enact displays the process for this data stream.
- Feature. Enact displays the feature for this data stream.
- % Out of Spec. Enact displays the percentage of pieces out of specification for this data stream.
- % Out of Control. Enact displays the total number of subgroups out of control for this data stream.
-
-
Flipping Individual Sub Tiles
Using this procedure, you can flip the desired sub tile to display the other side.
-
In the desired sub tile, select anywhere on the bottom OOS/OOC section.
- The sub tile rotates, displaying the other side.
-
-
Flipping All Sub Tiles
Using this procedure, you can flip all sub tiles on the Stream Summary tile to display the other sides.
- In the Stream Summary tile, select More and then select Flip Sub Tiles.
- All sub tiles in the Stream Summary tile rotate, displaying the other sides.
-
Opening Stream Summary Charts
Using this procedure, you can open stream summary charts from the desired sub tile.
-
In the desired sub tile, select anywhere on the top information section.
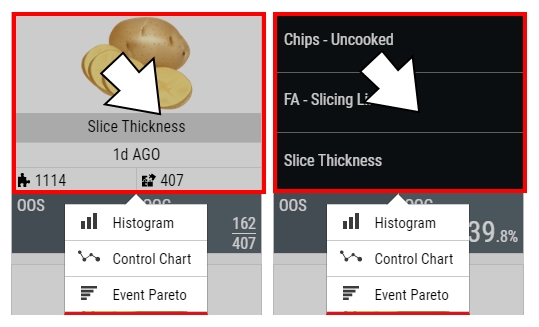
-
In the chart selection dialog box, select the desired chart:
-
-
Viewing All Stream Summaries
Using this procedure, you can view all of the stream summaries that you can access.
-
In the Stream Summary tile, select View All (#).
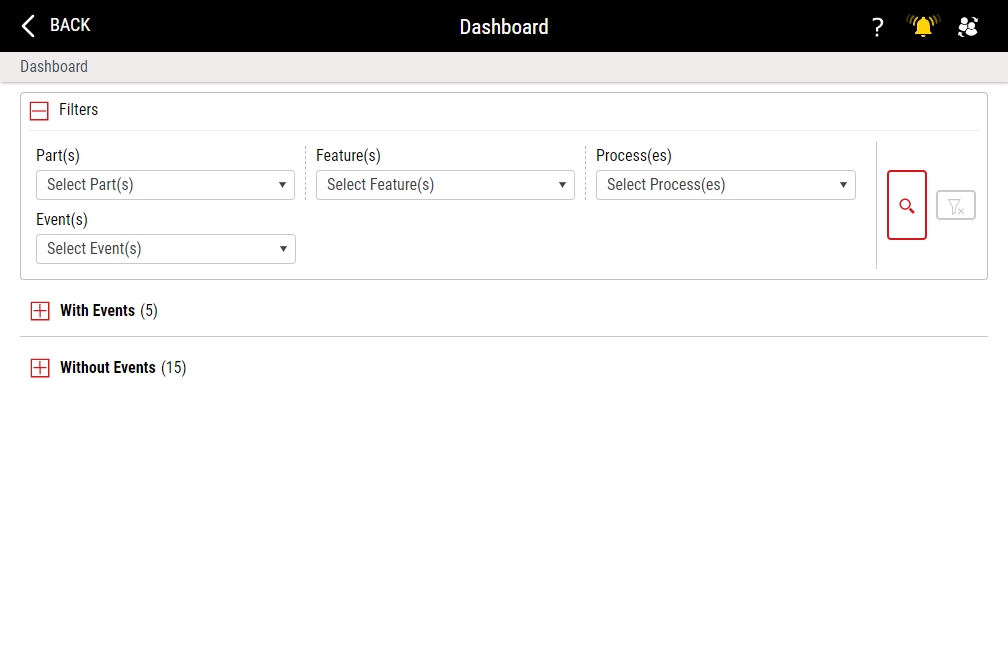
- In the Stream Summaries landing page, select Expand for the With Events and Without Events sections, and review all of the stream summaries.
-
-
Filtering Stream Summaries
-
Removing Tiles
Using this procedure, you will remove the Stream Summary tile.
-
In the unlocked dashboard, locate the Stream Summary tile.
For more information, please see Locking/Unlocking Dashboards.
- In the Stream Summary tile, select More and then select Remove Tile.
- Select Save.
-


