Managing Histogram Charts
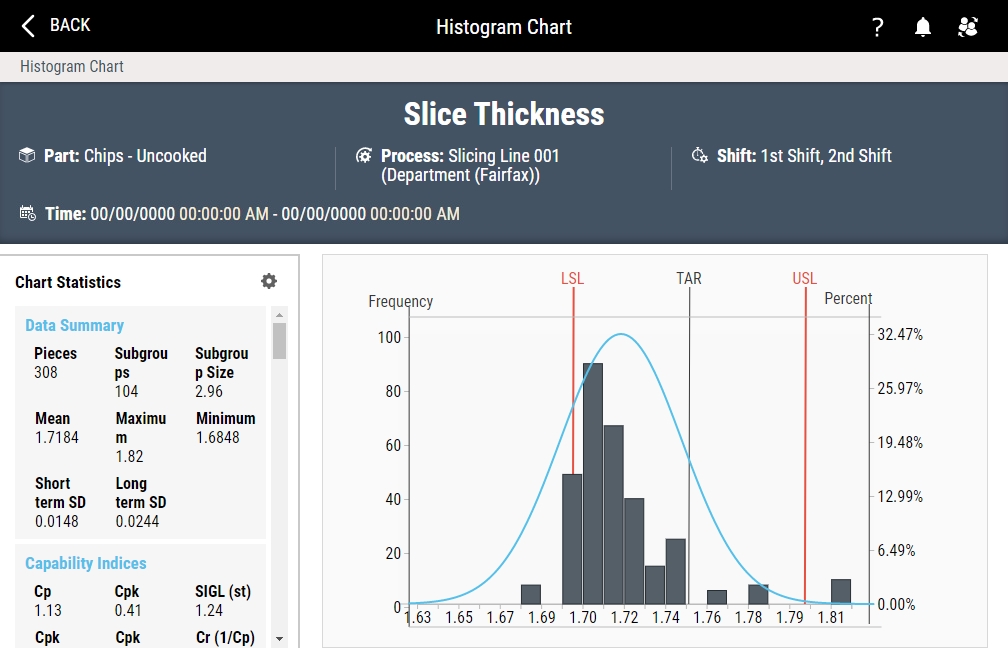
The Histogram chart illustrates the frequency distribution of data, including a graphical bell curve that represents a normal curve with the same mean and SD as the selected data set. Using this curve, you can see how close to a normal distribution the data is and what distribution would be expected for a larger data set. In addition, the accompanying report contains all associated statistics, including Data Summary, Capability Indices, Advanced Analytics, Specifications, Out of Specification, Net Content Control (MAV), Net Content Control (T1/T2), Deviations, Distribution of Values, Moments of Distribution, Chi squared Goodness of Fit, and Analysis of Variance.
-
In the Histogram chart, you can do the following:
-
 Examining Histogram Header
Using this procedure, you will examine the Histogram header.
-
Examine the Histogram header.

-
In the Histogram header, review the following data about the Histogram:
- Feature. Feature in the Histogram.
- Part. Part in the Histogram.
- Process. Process in the Histogram.
- Shift. Shift in the Histogram.
- Lot. Lot in the Histogram.
- Units. Unit type in the Histogram (for example, mm).
-
-
Viewing Statistics Information
Using this procedure, you will examine summarized data about the Histogram.
-
In the Chart Statistics panel, you can examine summarized data about the Histogram.
To display a missing statistic, do the following:
-
In the Chart Statistics panel, select Statistic Settings.
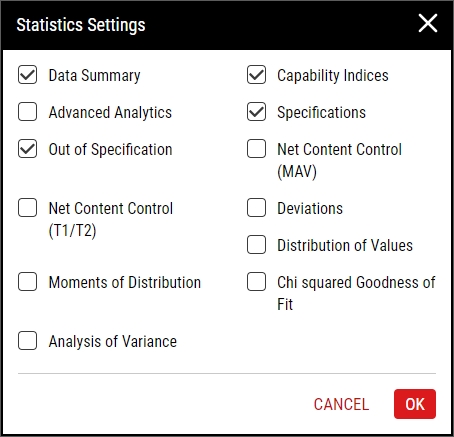
- In the Statistics Settings dialog box, select the desired statistic and then select OK.
-
Data Summary
- Pieces. Total number of pieces.
- Subgroups. Total number of subgroups.
- Subgroup Size. Total number of pieces within a subgroup.
-
Mean. Arithmetic average of a given data set, where N represents the number of values in the data set.
Formula - Maximum. Largest value entered for the feature.
- Minimum. Smallest value entered for the feature.
-
Short term SD. Short-term process variation estimated from either the within-subgroup standard deviation (for n > 1) or moving standard deviation (for n = 1) of the subgroups.
Formula -
Long term SD. Variation representing the average deviation of values from their mean, often called the RMS (root mean square) method of calculating sigma.
Formula
-
Capability Indices
-
Cp. Capability ratio using short-term standard deviation, comparing the specification limit spread to the spread of the variation of the data stream.
Formula -
Cpk. Capability ratio that is adjusted for non-centered processes, using short-term standard deviation, comparing the specification limit spread to the spread of the variation of the data stream. Cpk is equal to the smaller of Cpu or Cpl.
Formula -
SIGL (st). Sigma level based on the short-term sigma.
Formula -
Cpk Upper. Difference between the upper specification limit and the process mean, divided by three standard deviations. The standard deviation is estimated using the short-term Rbar method.
Formula -
Cpk Lower. Difference between the process mean and the lower specification limit, divided by three standard deviations. The standard deviation is estimated using the short-term Rbar method.
Formula -
Cr (1/Cp). Inverse of the Cp.
Formula -
Pp. Ratio of the process variability (six sigma) with the width of the specification limits (total tolerance). The standard deviation (sigma) is calculated using the root mean square method (RMS).
Formula -
Ppk. Capability ratio that is adjusted for non-centered processes, using long-term standard deviation, comparing the specification limit spread to the spread of the variation of the data stream. Ppk is equal to the smaller of Ppu or Ppl.
Formula -
SIGL (lt). Sigma level based on the long-term sigma.
Formula -
Ppk Upper. Difference between the upper specification limit and the process mean, divided by three standard deviations. The standard deviation (sigma) is calculated using the root mean square method (RMS).
Formula -
Ppk Lower. Difference between the lower specification limit and the process mean, divided by three standard deviations. The standard deviation (sigma) is calculated using the root mean square (RMS) method.
Formula -
Pr (1/Pp). Inverse of the Pp.
Formula
-
-
Advanced Analytics
-
CoVar. Ratio of the long term standard deviation (SD) to the mean, expressed as a percent. Also known as coefficient of variation.
Formula - Z-bench. Total probability that a part's test value will be out of specification.
-
Target Ratio. Measurement that determines if the process is centered on the target value (0 Process mean is equal to target value and process is centered; 1 Process is off-center from target ratio; >0 and <1 Include Cp with Target Ratio to determine if process is centered, as recommended by Phillips).
Formula - Mean - 3SD (lt). 3SD(lt) subtracted from the mean.
- Mean + 3SD (lt). 3SD(lt) added to the mean.
-
Robustness. Ratio of short term to long term standard deviation, expressed as a percent. The closer this percent is to 100, the more stable the process is over time.
Formula -
Cpm. Variation between the process average and target value as well as the process standard deviation, where T is the target value. The standard deviation is estimated using the short-term Rbar method.
Formula -
Ppm. Variation between the process average and target value as well as the process standard deviation, where T is the target value. The standard deviation is calculated using the root mean square (RMS) method.
Formula
-
-
Specifications
- USL. Highest value in which a given service or product may perform.
- LSL. Lowest value in which a given service or product must perform.
- Target. Desired process centering.
-
Z USL. Upper specification limit expressed in units of standard deviations from the distribution mean. Also known as Z score or Z value. If the upper specification limit is smaller than the mean, the Z USL will be a negative number.
Formula -
Z Target. Target expressed in units of standard deviations from the distribution mean (Negative Value Target is smaller than the mean; Positive Value Target is greater than the mean; 0 (zero) Target and mean are equal).
Formula -
Z LSL. Lower specification limit expressed in units of standard deviations from the distribution mean. Also known as Z score or Z value. If the lower specification limit is larger than the mean, the Z LSL will be a negative number.
Formula
-
Out of Specification
- Actual Above. Percent of test values above the upper specification limit for the part and test specified by the data selection.
- Actual Below. Percent of test values below the lower specification limit for the part and test specified by the data selection.
- Actual Total. Total percent of test values that exceeded the specification limits for the part and test specified in the data selection.
- Expected Above. Percent of test values that are expected to exceed the upper specification limit for the part and test specified by the data selection.
- Expected Below. Percent of test values that are expected to exceed the lower specification limit for the part and test specified in the data selection.
- Expected Total. Percent of test values that are expected to exceed either the upper or lower specification limits for the part and test specified in the data selection.
- Actual PPM. Total actual fallout expressed in terms of parts per million, calculated by the actual total percentage multiplied by a million.
- Expected PPM. Total expected fallout expressed in terms of parts per million, calculated by the expected total percentage multiplied by one million.
-
Net Content Control (MAV)
- LSC. Label Stated Content, which is the volume/weight label typically found on food items.
- <LSC. Percent of measured values that fell below the Label Stated Content.
- >LSC. Percent of measured values that fell above the Label Stated Content.
- MAV (L). Maximum Allowable Variation Lower, which is the food-specific specification for USA manufacturers; similar to the Lower Specification Limit.
- Max % < MAV (L). Percent of the measured values that are "allowed" to fall below the Maximum Allowable Variation Lower; configured in the Net Content Control record.
- <MAV (L). Percent of measured values that fell below the Maximum Allowable Variation Lower.
- MAV (U). Maximum Allowable Variation Upper, which is the food-specific specification for USA manufacturers; similar to the Upper Specification Limit.
- Max % > MAV (U). Percent of the measured values that are "allowed" to fall above the Maximum Allowable Variation Upper; configured in the Net Content Control record.
- >MAV (U). Percent of measured values that fell above the Maximum Allowable Variation Upper.
-
Net Content Control (T1/T2)
- LSC. Label Stated Content, which is the volume/weight label typically found on food items.
- <LSC. Percent of measured values that fell below the Label Stated Content.
- >LSC. Percent of measured values that fell above the Label Stated Content.
- T1 (L). T1 Lower; configured in the Net Content Control record.
- <T1 (L). Percent of measured values that fell below the T1 Lower.
- MAX T2 (L) < % < T1 (L). Maximum allowable percent of measured values that can fall between T2 Lower and T1 Lower.
- T2 (L) < % < T1 (L). Percent of measured values that fall between T2 Lower and T1 Lower.
- T2 (L). T2 Lower; configured in the Net Content Control record.
- Max % < T2 (L). Percent of the measured values that are "allowed" to fall below the T2 Lower; configured in the Net Content Control record.
- <T2 (L). Percent of measured values that fell below the T2 Lower.
- T1 (U). T1 Upper; configured in the Net Content Control record.
- >T1 (U). Percent of measured values that fell above the T1 Upper.
- T2 (U). T2 Upper; configured in the Net Content Control record.
- Max % > T2 (U). Percent of the measured values that are "allowed" to fall above the T2 Lower; configured in the Net Content Control record.
- >T2 (U). Percent of measured values that fell above the T2 Upper.
- MAX T1 (U) < % < T2 (U). Maximum allowable percent of measured values that can fall between T1 Upper and T2 Upper.
- T1 (U) < % < T2 (U). Percent of measured values that fall between T1 Upper and T2 Upper.
-
Deviations
- Deviation (LSC). Dataset's Mean minus the Net Content Control Limit's Label Stated Content (LSC) value.
- %Deviation (LSC). Deviation (LSC) divided by LSC.
- Deviation (Spec). Dataset's Mean minus the Specification Limit Target value.
- Deviation (Process Mean). Dataset's Mean minus the Control Limit Process Mean.
-
Distribution of Values
- >USL (Actual). Actual percent of values that fell above the Upper Specification Limit.
- >UWL (Actual). Actual percent of values that fell above the Upper Warning Limit.
- >TAR (Actual). Actual percent of values that fell above the Target.
- >USL (Expected). Expected percent of values expected to fall above the Upper Specification Limit, based on the selected processing (Normal distribution or Johnson System).
- >UWL (Expected). Expected percent of values expected to fall above the Upper Warning Limit, based on the selected processing (Normal distribution or Johnson System).
- >TAR (Expected). Expected percent of values expected to fall above the Target, based on the selected processing (Normal distribution or Johnson System).
- <LSL (Actual). Actual percent of values that fell below the Lower Specification Limit.
- <LWL (Actual). Actual percent of values that fell below the Lower Warning Limit.
- <TAR (Actual). Actual percent of values that fell below the Target.
- <LSL (Expected). Expected percent of values expected to fall below the Lower Specification Limit, based on the selected processing (Normal distribution or Johnson System).
- <LWL (Expected). Expected percent of values expected to fall below the Lower Warning Limit, based on the selected processing (Normal distribution or Johnson System).
- <TAR (Expected). Expected percent of values expected to fall below the Target, based on the selected processing (Normal distribution or Johnson System).
-
Moments of Distribution
-
Mean. Arithmetic average of a given data set, where N represents the number of values in the data set.
Formula -
Avg Deviation. Average data point deviation from their mean, which is a more robust estimate of the variability than the variance or standard deviation.
Formula -
Standard Deviation. Variation representing the average deviation of values from their mean, often called sigma because the Greek letter sigma is used as a symbol for standard deviation.
Formula -
Variance. Spread of data about the mean.
Formula -
Skewness. Degree of asymmetry of the distribution of test values about the mean value, which characterizes the shape of the distribution (Positive Value Skewness tail extends out to a more positive value; Negative Value Skewness tail extends out to a more negative value).
Formula -
Kurtosis. Degree of peakedness or flatness of the distribution relative to a normal distribution (Positive Value The distribution is more pointed; Negative Value The distribution is more rounded; 0 (zero) The distribution is normal).
Formula
-
-
Chi squared Goodness of Fit
-
Chi-Squared. General statistic that compares observed values to expected values. The Goodness of Fit test uses the Chi-Squared statistic to assess if the observed values in the data set exhibit the distributional characteristics of a normal distribution. More specifically, the test compares the observed values in a given histogram bin to the expected values that should be in that bin if the distribution was indeed normal.
Formula - DF. Degrees of freedom, which is n-1, where n is the number of bins with data.
- Chi Sq Prob. P-value, calculated from the Chi Squared and degrees of freedom. If chi squared probability is less than 0.05, the actual distribution does not compare with the expected distribution. For the goodness of fit test, the null hypothesis is that the distribution is indeed normally distributed. A p-value below 0.05 results in a rejected null hypothesis, which prevents the conclusion that the distribution is normally distributed. A p-value greater than 0.05 results in a failure to reject the null hypothesis, which prevents the conclusion that the distribution is not normally distributed.
- Fit To Curve. Demonstrate how well an actual collection of data values compare to an ideal statistical distribution (or “curve”) calculated from those values. If the data values are well behaved and clustered together, the fit to curve will be good. Conversely, if some of the data values are erroneous or highly abnormal, the “fit to curve” will be poor.
-
-
Analysis of Variance
-
SS Between. Sum of Squares Between. Variation between the subgroup means. The Degrees of Freedom used to evaluate the F-Ratio (d.f.=k-1).
Formula - df Between. Degrees of freedom Between.
- MS Between. Mean Square Between.
- SS Within. Sum of Squares Within. Variation within the subgroups.
- df Within. Degrees of freedom Within.
- MS Within. Mean Square Within.
-
SS Total. Sum of Squares Total. Sum of the Sum of Squares Between and the Sum of Squares Within.
Formula - df Total. Degrees of freedom Total.
-
F-Ratio. Mean Square Between divided by Mean Square Within.
Formula - Prob of F. For Analysis of Variance, the null hypothesis is that the level of variation within a subgroup is equal to the level of variation between subgroups. A p-value below 0.05 results in a rejected null hypothesis, prevents the conclusion that the within and between variation are the same. A p-value greater than 0.05 results in a failure to reject the null hypothesis, which prevents the conclusion that the variation levels within and between subgroups are not the same.
-
-
-
-
- Select Back.


