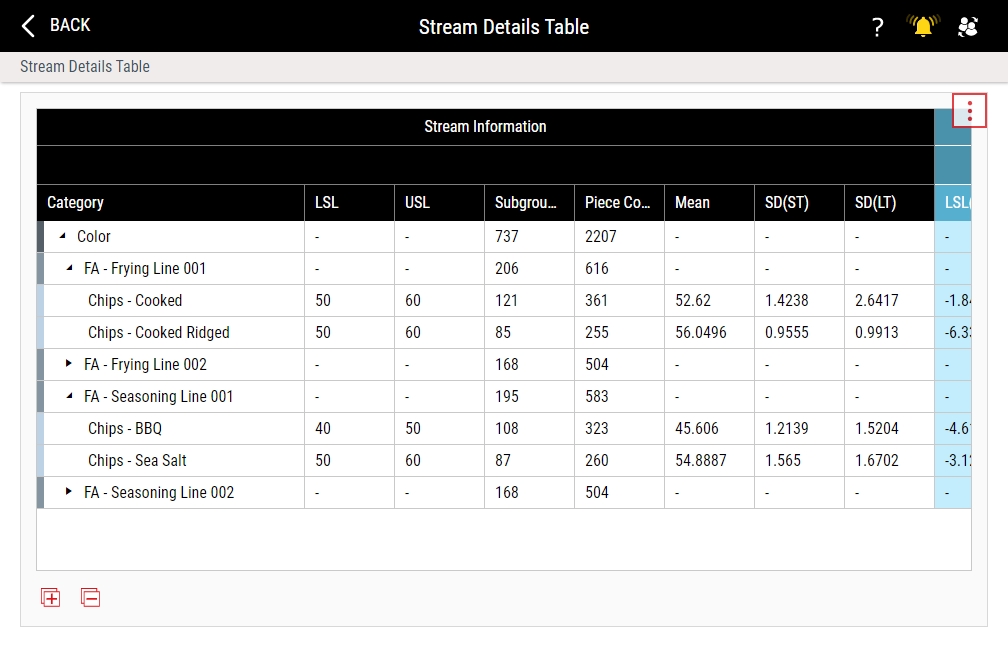
Managing Stream Details Page (Grading Matrix)
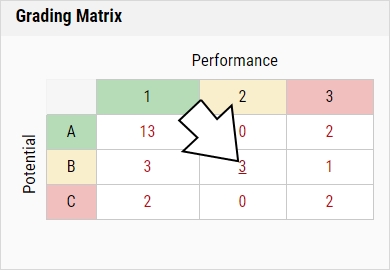
The Stream Details Page displays the data streams for the selected table cell in the Grading Matrix tile.
- In the Grading Matrix tile, locate the desired table cell.
-
In the Grading Matrix tile, select the counter for the desired data stream grading.
-
In the Stream Details Page, you can do the following:
-
 Opening Grading Matrix Charts
Using this procedure, you can open charts from the Grading Matrix Stream Details Page.
- In the Chart column of the desired data stream, select Chart.
-
In the chart selection dialog box, select the desired chart:
-
Configuring Stream Details Table Columns
Using this procedure, you will control the columns that Enact displays.
-
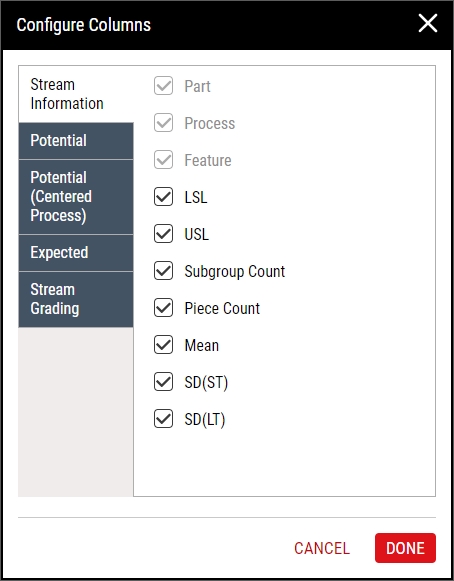
In the Stream Details Table, select More and then select Configure Columns.
-
In the Configure Columns dialog box, select the desired tab and then select the desired columns:
-
Stream Information
- LSL. Lower Specification Limit.
- USL. Upper Specification Limit.
- Subgroup Count. Total number of subgroups.
- Piece Count. Total number of measurement values.
-
Mean. Arithmetic average of a given data set, where N represents the number of values in the data set.
Formula -
SD(ST). Short-term process variation estimated from either the within-subgroup standard deviation (for n > 1) or moving standard deviation (for n = 1) of the subgroups.
Formula -
SD (LT). Variation representing the average deviation of values from their mean, often called the RMS (root mean square) method of calculating sigma.
Formula
-
Potential
-
LSL(Z). Lower specification limit expressed in units of short-term standard deviations from the distribution mean. Also known as Z score or Z value. If the lower specification limit is larger than the mean, the LSL(Z) will be a negative number.
Formula -
USL(Z). Upper specification limit expressed in units of short-term standard deviations from the distribution mean. Also known as Z score or Z value. If the upper specification limit is smaller than the mean, the USL(Z) will be a negative number.
Formula - Weighted Fraction < LSL. Projected fraction fallout below Lower Specification Limit. Statistic is weighted based on piece count and short-term standard deviation.
- Weighted Fraction > USL. Projected fraction fallout above Upper Specification Limit. Statistic is weighted based on piece count and short-term standard deviation.
- Fraction < LSL. Projected fraction fallout below Lower Specification Limit based on short-term standard deviation.
- Fraction > USL. Projected fraction fallout above Upper Specification Limit based on short-term standard deviation.
- PDPM. Potential Defects Per Million. Statistic is based on projected fallout on either side of the specification based on short-term standard deviation.
- Yield. Percentage of potential good pieces from total pieces measured based on short-term standard deviation.
- Cpk. 2D Chart. Capability ratio that is adjusted for non-centered processes, using short-term standard deviation, comparing the specification limit spread to the spread of the variation of the data stream. Cpk is equal to the smaller of Cpu or Cpl. Formula

-
-
Potential (Centered Process)
- Spec(Z). Specification limit expressed in units of short-term standard deviations from the distribution mean. Also known as Z score or Z value. Because the process is assumed to be centered, the Spec(Z) will be identical for both the USL and LSL.
- Weighted Fraction OOS. Projected fraction fallout. Statistic is weighted based on piece count and short-term standard deviation.
- Fraction OOS. Projected fraction fallout based on short-term standard deviation.
- PDPM. Potential Defectives Per Million. Statistic is based on projected fallout on either side of the specification and short-term standard deviation.
- Yield. Percentage of potential good pieces from total pieces measured based on short-term standard deviation.
-
Cp. 2D Chart. Capability ratio using short-term standard deviation, comparing the specification limit spread to the spread of the variation of the data stream.
Formula
-
Expected
-
LSL(Z). Lower specification limit expressed in units of long-term standard deviations from the distribution mean. Also known as Z score or Z value. If the lower specification limit is larger than the mean, the LSL(Z) will be a negative number.
Formula -
USL(Z). Upper specification limit expressed in units of long-term standard deviations from the distribution mean. Also known as Z score or Z value. If the upper specification limit is smaller than the mean, the USL(Z) will be a negative number.
Formula - Weighted Fraction < LSL. Projected fraction fallout below Lower Specification Limit. Statistic is weighted based on piece count and long-term standard deviation.
- Weighted Fraction > USL. Projected fraction fallout above Upper Specification Limit. Statistic is weighted based on piece count and long-term standard deviation.
- Fraction < LSL. Projected fraction fallout below Lower Specification Limit based on long-term standard deviation.
- Fraction > USL. Projected fraction fallout above Upper Specification Limit based on long-term standard deviation.
- DPM. Defectives Per Million. Statistic is based on projected fallout on either side of the specification and long-term standard deviation.
- Yield. Percentage of potential good pieces from total pieces measured based on long-term standard deviation.
-
Ppk. 2D Chart. Capability ratio that is adjusted for non-centered processes, using long-term standard deviation, comparing the specification limit spread to the spread of the variation of the data stream. Ppk is equal to the smaller of Ppu or Ppl.
Formula
-
-
Stream Grading
- Grade. A grading rank with nine potential outcomes (A1, A2, A3, B1, B2, B3, C1, C2, C3), with A1 being the best score and C3 being the worst score. The A, B, C portion of the grade relates to the width of the bell curve compared to the specification limits. The 1, 2, 3 portion of the grade relates to how well the process is centered on target. A grade of A1 means that the process is “tight and centered.” A C3 grade indicates a process with undesirable variation and not targeted very well.
- Yield Potential (Centered Process). An indication the best expected yield using short-term standard deviation and a centered process.
- Yield Performance. The ratio of Expected Yield and Yield Potential.
- Expected Yield. An indication of actual yield taking into account off-centeredness and long-term standard deviation.
-
- Select Done.
- Select Back.
-
-


