Creating Processing Templates
Using this procedure, you will create the processing template.
Enact automatically updates processing templates every 10 minutes, which means there will be a slight delay before you see recent changes.
- Select Access Menu and then select Analysis | Processing Templates.
-
In the Processing Templates landing page, select Create Processing Template.
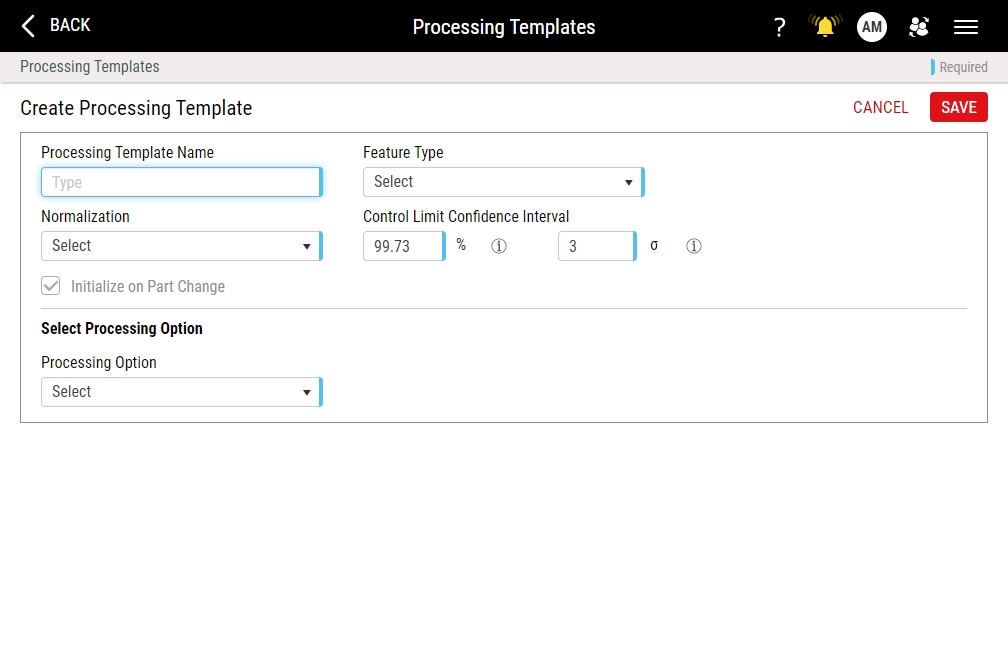
- In the Processing Template Name data field, type the processing template name.
- In the Feature Type drop-down list, select the desired feature type.
-
In the Normalization drop-down list, select the desired normalization setting:
- None. (Variable or Attribute) Display data in its original format without performing any data normalization.
- Target. (Variable Only) Normalize data as deviation from the target value specified in the specification limit record.
- Nominal. (Variable Only) Normalize data as deviation from the engineering specification nominal, which is defined as (USL-LSL)/2, a value that lies halfway between its upper and lower specification limits.
- Standardized. (Variable or Attribute) Normalize data using standardized data transformation, plotting points in terms of standard deviation units. All standardized charts have a centerline of zero and control limits of ±3. The standardized chart allows you to combine dissimilar data, with different expected means and standard deviations, on a single chart sharing the same control limits.
- Process Mean. (Variable Only) Normalize data as deviation from the process mean value specified in the control limit record.
- Under Control Limit Confidence Interval, you can override the default 3 sigma constraint typically used to calculate control limits for monitoring central tendency. The interval can be modified by typing the interval expressed as a % (90 - 99.999) or in terms of σ (1.632 - 4.417 σ).
-
(Variable Only) In the Processing Option drop-down list, select the desired processing option setting, which generates alarms and events but does not affect control charts:
- None. Display data in its original format without applying any processing options.
- Economic Control Limit (ECL). Economic control limits allow the process mean to shift and drift, so long as a plot point does not violate the control limits based on the Target Cp. The default Target Cp is 1.33, but can be modified on the Part Feature Details page. For more information about setting the Target Cp, please see Creating Part Feature Details.
- Shewhart CUSUM. Determine the deviations from the control chart's centerline or target value for each subgroup value, which is useful if a process is affected by small shifts in its mean or variability, plotting the accumulated difference divided by the square root of the subgroup size.
- Tabular CUSUM. Determine the deviations from the control chart's centerline or target value for each subgroup value, which is useful if a process is affected by small shifts in its mean or variability, plotting positive and negative deviations as separate lines.
- Exponentially Weighted Moving Average (EWMA). Detect small shifts in the mean or variation by determining a moving average of the previous data, assigning each data point a weight that decreases from present to past in an exponentially decaying fashion. These weighting factors can vary from 0 to 1, with the most common weights varying between 0.05 and 0.20.
- Coefficient of Variation (%CV). Ratio of the long term standard deviation (SD) to the mean, expressed as a percent.
- Select Save.
