Managing Stream Overview Reports
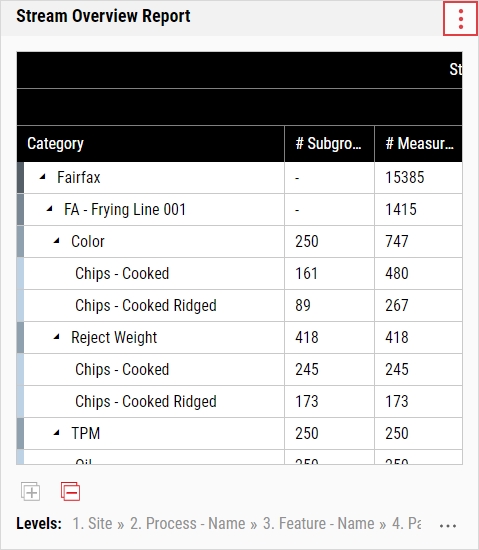
The Stream Overview Report displays a compilation of different statistical metrics, including fallout metrics, capability indices, and net content control values, as well as the new Composite Quality Score (CQS) metric, which combines variable and attribute violations into a single metric.
When you select the parameter set on the dashboard, it will affect the contents of this tile.
-
In the aggregated dashboard toolbar, select Add Tile and then select the Stream Overview Report.
-
In the Stream Overview Report, you can do the following:
- Selecting Parameter Sets
-
 Defining Levels
Using this procedure, you will classify the data into nested categories contained in two analysis profiles, Site and Feature.
If you select By Shift in the parameter set's time window, Enact will have aggregated data upon the last shift change, and will be able to categorize by shift. If you select Dynamic Time or Static Time in the parameter set's time window, Enact hides the shift level. For more information, please see Creating Parameter Sets.
-
In the Stream Overview Report, select More and then select Define Levels.
-
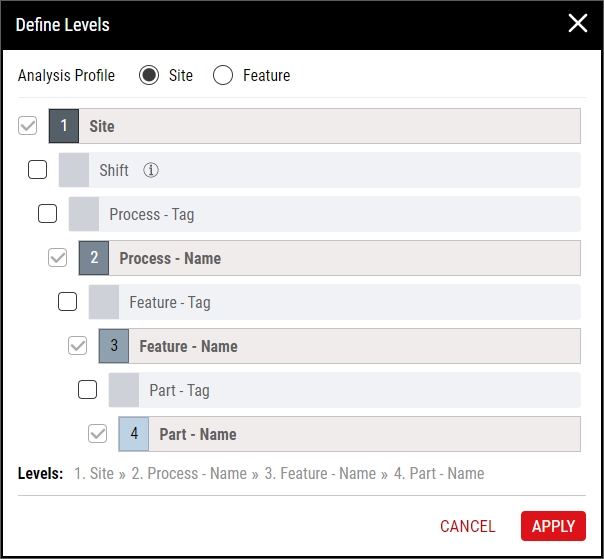
In the Define Levels dialog box, do the following:
-
In the Analysis Profile data field, select the desired profile:
-
Site
Display site-based data, with site as the highest level, in the following nested order:
- Site. (default) Categorize the data by site.
-
Shift. Categorize the data by shift.
- Process - Tag. Categorize the data by process tag.
- Process - Name. (default) Categorize the data by process.
- Feature - Tag. Categorize the data by feature tag.
- Feature - Name. (default) Categorize the data by feature.
- Part - Tag. Categorize the data by part tag.
- Part - Name. (default) Categorize the data by part.
-
Feature
Display feature-based data, with feature as the highest level, in the following nested order:
- Feature - Tag. Categorize the data by feature tag.
- Feature - Name. (default) Categorize the data by feature.
- Part - Tag. Categorize the data by part tag.
- Part - Name. (default) Categorize the data by part.
- Process - Tag. Categorize the data by process tag.
- Process - Name. (default) Categorize the data by process.
-
Shift. Categorize the data by shift.
-
- Select Apply.
-
-
-
Expanding Levels
Using this procedure, you will expand the nested levels to show the contents, if any.
To expand all levels, select Expand All.
- In the desired Stream Overview Report level, select Expand.
- The collapsed level expands.
-
Collapsing Levels
Using this procedure, you will collapse the nested levels to hide the contents, if any.
To collapse all levels, select Collapse All.
- In the desired Stream Overview Report level, select Collapse.
- The expanded level collapses.
-
Opening Stream Overview Charts
-
Aggregating Subprocess Data
Using this procedure, you can roll up subprocess data, viewing the individual subprocesses.
- In the Stream Overview Report, select More and then select Aggregate Subprocess Data.
- Locate and expand the parent process for the subprocesses, and then select Subprocesses or the subprocesses counter.
-
Configuring Stream Overview Report Columns
Using this procedure, you will control the columns that Enact displays on the Stream Overview Report.
-
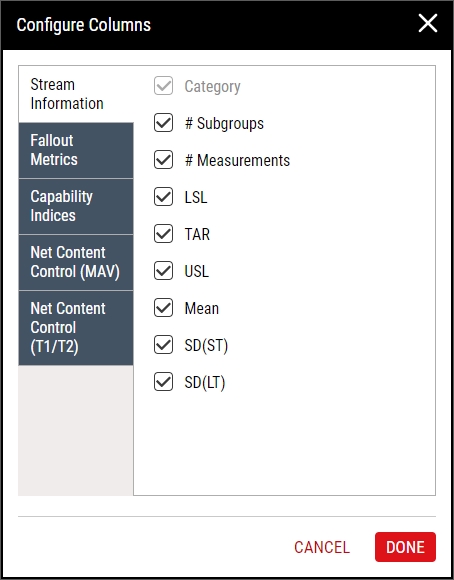
In the Stream Overview Report, select More and then select Configure Columns.
-
In the Configure Columns dialog box, select the desired tab and then select the desired columns:
-
Stream Information
- Category. Based on selected Analysis Profile in Defining Levels above, Enact organizes by site or feature.
- # Subgroups. Total number of subgroups.
- # Measurements. Total number of measurement values.
- LSL. Lower Specification Limit.
- TAR. Desired process centering.
- USL. Upper Specification Limit.
-
Mean. Arithmetic average of a given data set, where N represents the number of values in the data set.
Formula -
SD(ST). Short-term process variation estimated from either the within-subgroup standard deviation (for n > 1) or moving standard deviation (for n = 1) of the subgroups.
Formula -
SD (LT). Variation representing the average deviation of values from their mean, often called the RMS (root mean square) method of calculating sigma.
Formula
-
Fallout Metrics
- # <LSL. Number of measured values below the lower specification limit.
- # >USL. Number of measured values above the upper specification limit.
- # OOS. Number of measured values outside the specification limits.
- % OOS. Percent of measured values outside the specification limits.
- # Defects. Number of defects, weighted by code weight.
- % Defects. Percent of defects.
- # Defectives. Number of defectives, weighted by code weight.
- % Defectives. Percent of defectives.
- % CQS. (Composite Quality Score) Percent of out-of-specification measured values (total count of out-of-specifications at time of aggregation, regardless of triggered events), defects, and defectives that can be rolled up across any level. A higher CQS indicates worse performance.
- CQS (PPM). (Composite Quality Score) Total out-of-specification measured values (total count of out-of-specifications at time of aggregation, regardless of triggered events), defects, and defectives expressed in terms of parts per million, calculated by the actual total percentage multiplied by a million. A higher CQS indicates worse performance.
-
Capability Indices
-
Cp. Capability ratio using short-term standard deviation, comparing the specification limit spread to the spread of the variation of the data stream.
Formula -
Cpk. Capability ratio that is adjusted for non-centered processes, using short-term standard deviation, comparing the specification limit spread to the spread of the variation of the data stream. Cpk is equal to the smaller of Cpu or Cpl.
Formula -
Cpm. Variation between the process average and target value as well as the process standard deviation, where T is the target value. The standard deviation is estimated using the short-term Rbar method.
Formula -
Pp. Ratio of the process variability (six sigma) with the width of the specification limits (total tolerance). The standard deviation (sigma) is calculated using the root mean square method (RMS).
Formula -
Ppk. Capability ratio that is adjusted for non-centered processes, using long-term standard deviation, comparing the specification limit spread to the spread of the variation of the data stream. Ppk is equal to the smaller of Ppu or Ppl.
Formula -
Ppm. Variation between the process average and target value as well as the process standard deviation, where T is the target value. The standard deviation is calculated using the root mean square (RMS) method.
Formula
-
-
Net Content Control (MAV)
- LSC (MAV). Label Stated Content, which is the volume/weight label typically found on food items.
- MAV (L). Maximum Allowable Variation Lower, which is the food-specific specification for USA manufacturers; similar to the Lower Specification Limit.
- Max % < MAV (L). Percent of the measured values that are "allowed" to fall below the Maximum Allowable Variation Lower; configured in the Net Content Control record.
- MAV (U). Maximum Allowable Variation Upper, which is the food-specific specification for USA manufacturers; similar to the Upper Specification Limit.
- Max % > MAV (U). Percent of the measured values that are "allowed" to fall above the Maximum Allowable Variation Upper; configured in the Net Content Control record.
- # <MAV (L). Number of measured values that fell below the Maximum Allowable Variation Lower.
- % <MAV (L). Percent of measured values that fell below the Maximum Allowable Variation Lower.
- # >MAV (U). Number of measured values that fell above the Maximum Allowable Variation Upper.
- % >MAV (U). Percent of measured values that fell above the Maximum Allowable Variation Upper.
- DEV LSC (MAV). Process mean - Label Stated Content.
- % DEV LSC (MAV). Process mean - Label Stated Content, divided by Label Stated Content (or giveaway).
-
Net Content Control (T1/T2)
- T1 (L). T1 Lower; configured in the Net Content Control record.
- T2 (L). T2 Lower; configured in the Net Content Control record.
- Max % < T2 (L). Percent of the measured values that are "allowed" to fall below the T2 Lower; configured in the Net Content Control record.
- Max T2 (L) < % < T1 (L). Maximum allowable percent of measured values that can fall between T2 Lower and T1 Lower.
- T1 (U). T1 Upper; configured in the Net Content Control record.
- T2 (U). T2 Upper; configured in the Net Content Control record.
- Max % > T2 (U). Percent of the measured values that are "allowed" to fall above the T2 Lower; configured in the Net Content Control record.
- Max T2 (U) > % >T1 (U). Maximum allowable percent of measured values that can fall between T2 Upper and T1 Upper.
- # <T1 (L). Number of measured values that fell below the T1 Lower.
- % <T1 (L). Percent of measured values that fell below the T1 Lower.
- # <T2 (L). Number of measured values that fell below the T2 Lower.
- % <T2 (L). Percent of measured values that fell below the T2 Lower.
- # >T1 (U). Number of measured values that fell above the T1 Upper.
- % >T1 (U). Percent of measured values that fell above the T1 Upper.
- # >T2 (U). Number of measured values that fell above the T2 Upper.
- % >T2 (U). Percent of measured values that fell above the T2 Upper.
- DEV LSC (T1T2). Process mean - Label Stated Content.
- % DEV LSC (T1T2). Process mean - Label Stated Content, divided by Label Stated Content (or giveaway).
-
- Select Done.
-
-
Downloading Tiles
Using this procedure, you will download the contents of the Stream Overview Report into a Microsoft Excel spreadsheet.
-
In the locked dashboard, locate the Stream Overview Report.
For more information, please see Locking/Unlocking Dashboards.
- In the Stream Overview Report, select More and then select Download.
- In the Download dialog box, select Save, and in the Save As dialog box, browse to the desired save location on the computer (for example, the Windows Downloads folder).
-
In Microsoft Excel, open the saved file and examine the contents of the downloaded Stream Overview Report. Microsoft Excel displays the contents expanded or collapsed as it was in the Stream Overview Report.
-
-
Removing Tiles
Using this procedure, you will remove the Stream Overview Report.
-
In the unlocked dashboard, locate the Stream Overview Report.
For more information, please see Locking/Unlocking Dashboards.
- In the Stream Overview Report, select More and then select Remove Tile.
- Select Save.
-


