Managing Pareto Tiles
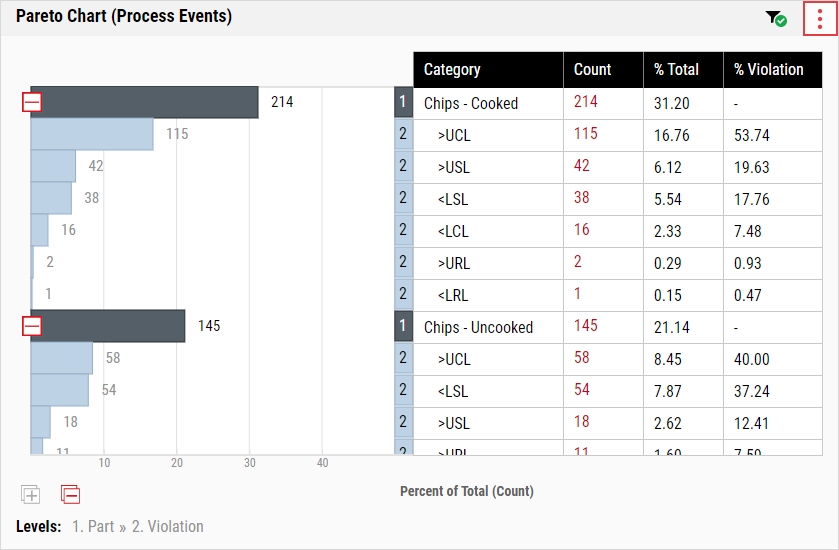
The Pareto tile displays the occurrences of subgroup data, collected data, or process events (including edited subgroup events) on a bar chart, most frequent to least frequent, which you can further organize into categories. For example, you can organize data by event code, and further organize the data by process.
In the Pareto tile, Enact organizes the selected levels by number and indent, and includes a legend at the bottom to identify the level categories. In order to view this information correctly, you must set your computer's display scaling to 100%. If you do not set your computer's display scaling to 100%, Enact may render the report contents misaligned, and the level numbering will not correspond to the category entry.
When you select the parameter set on the dashboard, it will affect the contents of this tile.
-
In the raw dashboard toolbar, select Add Tile and then select the Pareto tile.
-
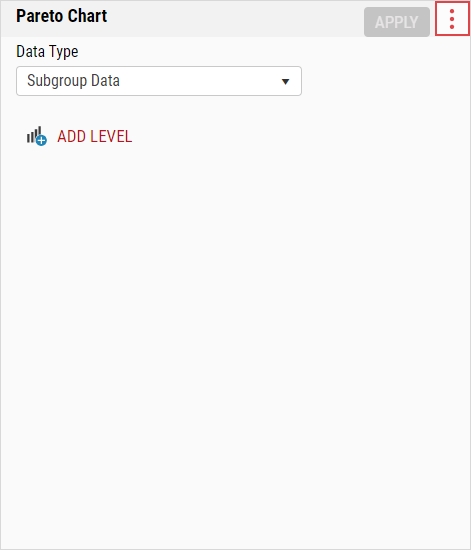
In the Data Type drop-down list, select the desired data type:
- Subgroup Data. Display subgroup data in Pareto tile.
- Process Events. Display process events in Pareto tile. For more information, please see Managing Process Events Tables.
- Collected Data. Display data collection activities (Automatic, Checklist, Manual) in Pareto tile. For more information, please see Managing Collected Data Tables.
-
In the Pareto tile, you can do the following:
- Selecting Parameter Sets
-
 Defining Levels
Using this procedure, you will classify the data into nested categories, up to a maximum of 10 levels.
When you add the Pareto tile for the first time, you must define the levels before doing anything else. Please follow the defining levels instructions below, and then select Apply.
-
In the Pareto tile, select More and then select Define Levels.
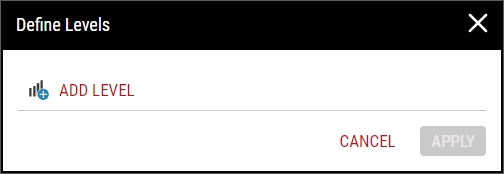
-
In the Define Levels dialog box, select Add Level.
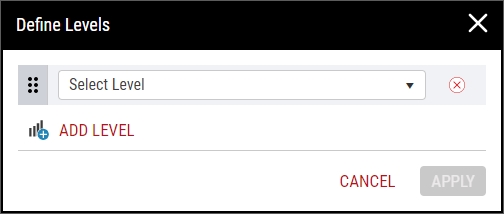
-
In the Select Level drop-down list, select the desired level type:
-
Subgroup Data
- Time. Categorize the data by unit of time.
- Hierarchy. Categorize the data by process type.
- Part. Categorize the data by part (Name) or tag group associated with parts (Tag Group / Tag).
- Feature. Categorize the data by feature (Name) or tags associated with features (Tag Group / Tag).
- Shift. Categorize the data by shift.
- Lot. Categorize the data by lot (Name) or tags associated with lots (Tag Group / Tag).
- Code. Categorize the data by code (Name) or tags associated with codes (Tag Group / Tag).
-
Process Events
- Violation. Categorize the data by violations (for example, >USL, <LSL, >UCL, <LCL, etc.).
- Time. Categorize the data by unit of time.
- Hierarchy. Categorize the data by process type.
- Part. Categorize the data by part (Name) or tag group associated with parts (Tag Group / Tag).
- Feature. Categorize the data by feature (Name) or tags associated with features (Tag Group / Tag).
- Shift. Categorize the data by shift.
- Lot. Categorize the data by lot (Name) or tags associated with lots (Tag Group / Tag).
- Status. (Process Event only) Categorize the data by event status (Open or Completed).
- Event Code. Categorize the data by event code.
- User. Categorize the data by user performing the data entry.
-
Collected Data
- Collected Data Type. Categorize the data by data collection activities (Automatic, Checklist, Manual).
- Collection Name. Categorize the data by data collection.
- Time. Categorize the data by unit of time.
- Hierarchy. Categorize the data by process type.
- Shift. Categorize the data by shift.
- User. Categorize the data by user performing the data entry.
-
- To add additional levels, repeat the above steps.
- To reorder the existing levels (when more than one exists), select and drag Reorder.
- To remove an existing level, select Delete.
- Select Apply.
-
-
Expanding Levels
Using this procedure, you will expand the nested levels to show the contents, if any.
To expand all levels, select Expand All.
Graph / Graph & Report View Type
- In the desired Pareto tile level, select Expand.
- The collapsed level expands.
Report View Type
- In the desired Pareto tile level, select Expand.
- The collapsed level expands.
-
Collapsing Levels
Using this procedure, you will collapse the nested levels to hide the contents, if any.
To collapse all levels, select Collapse All.
Graph / Graph & Report View Type
- In the desired Pareto tile level, select Collapse.
- The expanded level collapses.
Report View Type
- In the desired Pareto tile level, select Collapse.
- The expanded level collapses.
-
Viewing Chart Summary
Using this procedure, you will open the summarized data about the Pareto tile.
-
In the Pareto tile, select More and then select Chart Summary.
Alternatively, you can open the Pareto tile summary panel by doing the following:
- Select the Pareto tile.
- In the upper left hand corner of the dashboard, select Chart Summary.
-
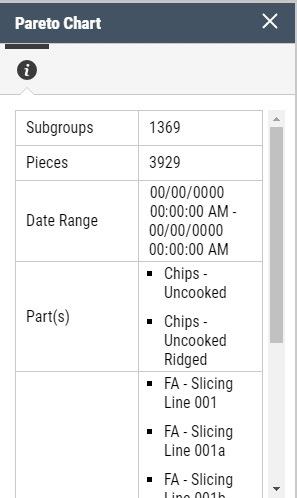
In the Pareto tile summary panel, review the following data about the Pareto tile:
-
Subgroup Data
- Subgroups. Subgroup count in the dashboard's selected parameter set.
- Pieces. Piece count in the dashboard's selected parameter set.
- Date Range. Start and end date for the collected data in the dashboard's selected parameter set.
- Part(s). Parts in the dashboard's selected parameter set.
- Process(es). Processes in the dashboard's selected parameter set.
- Feature(s). Features in the dashboard's selected parameter set.
-
Process Events
- Total Events. Event count in the dashboard's selected parameter set.
- Date Range. Start and end date for the collected data in the dashboard's selected parameter set.
- Part(s). Parts in the dashboard's selected parameter set.
- Process(es). Processes in the dashboard's selected parameter set.
- Feature(s). Features in the dashboard's selected parameter set.
-
Collected Data
- Total OOC. Out of control subgroup count in the dashboard's selected parameter set.
- Total OOS. Out of specification subgroup count in the dashboard's selected parameter set.
- Data Collection(s). Total number of data collections completed in the dashboard's selected parameter set.
- Checklist(s). Total number of checklists completed in the dashboard's selected parameter set.
- Automated Data Collection(s). Total number of automated data collections completed in the dashboard's selected parameter set.
- Process(es). Processes in the dashboard's selected parameter set.
If you filter the dashboard's parameter set, Enact automatically updates the data in the Pareto tile summary panel. For more information about filtering the dashboard's parameter set, please see Filtering Dashboard Parameter Sets.
-
-
-
Setting View Type
Using this procedure, you will select the display of the Pareto tile.
-
In the Pareto tile, select More and then select Select View Type.
-
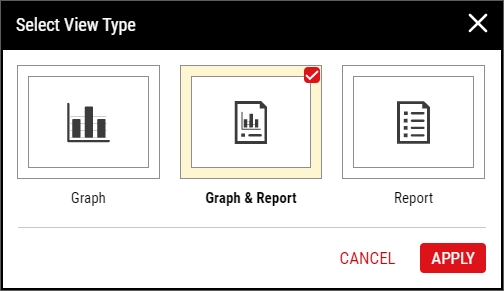
In the Select View Type dialog box, select the desired display of the Pareto tile:
- Graph. Display the Pareto tile graph only.
- Graph & Report. Display the Pareto tile graph and report.
- Report. Display the Pareto tile report only.
- Select Apply.
-
-
Filtering Events
This function only applies to the Process Events Pareto tile.
Using this procedure, you will control the content the Process Events Pareto tile displays, including the process event status (Open, Completed), workflow assignment status (Yes, No), and the various process event types (Manufacturing Limit Violations, Statistical Violations, Defectives, etc.).
-
In the Process Events Pareto tile, select Filter.
-
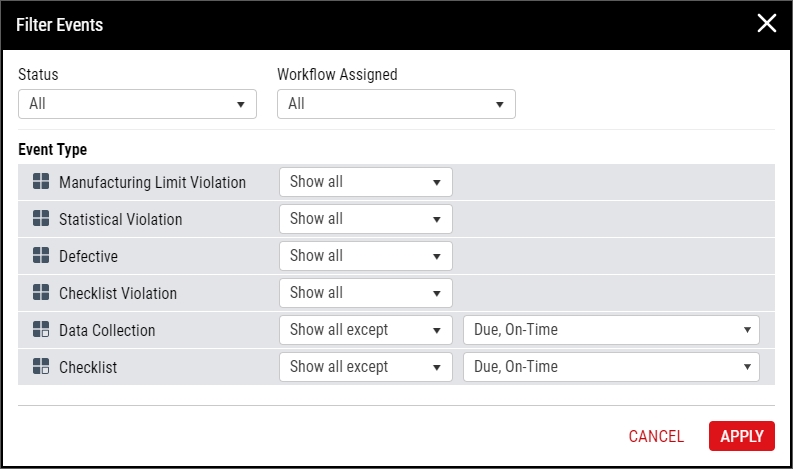
In the Filter Events dialog box, filter the displayed process events as follows:
-
Filter by Process Event Status
In the Event drop-down list, select the desired process event status:
- All. Display all process event statuses.
- Open. Display process events with no events codes assigned.
- Completed. Display process events with event codes assigned.
-
Filter by Workflow Assignment Status
In the Workflow Assigned drop-down list, select the desired workflow assignment status:
- All. Display all process events, with or without workflow assignments.
- Yes. Display process events with workflows assigned.
- No. Display process events without workflows assigned.
-
Filter by Manufacturing Limit Violations
In the Manufacturing Limit Violation drop-down list, select the filter type:
- Show all. (default) Display all manufacturing limit violations (for example, Above USL, Below LSL, Above URL, etc.).
- Hide all. Hide all manufacturing limit violations (for example, Above USL, Below LSL, Above URL, etc.).
- Show all except. Display all manufacturing limit violations, except for the violations selected in the second drop-down list (for example, Above USL, Below LSL, Above URL, etc.).
- Hide all except. Hide all manufacturing limit violations, except for the violations selected in the second drop-down list (for example, Above USL, Below LSL, Above URL, etc.).
-
Filter by Statistical Violations
In the Statistical Violation drop-down list, select the filter type:
- Show all. (default) Display all statistical violations (for example, >UCL, <LCL, 2/3 UZA, etc.).
- Hide all. Hide all statistical violations (for example, >UCL, <LCL, 2/3 UZA, etc.).
- Show all except. Display all statistical violations, except for the violations selected in the second drop-down list (for example, >UCL, <LCL, 2/3 UZA, etc.).
- Hide all except. Hide all statistical violations, except for the violations selected in the second drop-down list (for example, >UCL, <LCL, 2/3 UZA, etc.).
-
Filter by Defectives
In the Defective drop-down list, select the filter type:
- Show all. (default) Display all defectives.
- Hide all. Hide all defectives.
- Show all except. Display all defectives, unless you select Defective in the second drop-down list.
- Hide all except. Hide all defectives, unless you select Defective in the second drop-down list.
-
Filter by Checklist Violations
In the Checklist Violation drop-down list, select the filter type:
- Show all. (default) Display all checklist violations.
- Hide all. Hide all checklist violations.
- Show all except. Display all checklist violations, unless you select Track count exceeded in the second drop-down list.
- Hide all except. Hide all checklist violations, unless you select Track count exceeded in the second drop-down list.
-
Filter by Data Collection Compliance
In the Data Collection drop-down list, select the filter type:
- Show all. Display all data collection compliance results (for example, Late or Missed).
- Hide all. Hide all data collection compliance results.
- Show all except. Display all data collection compliance results, except for the compliance selections in the second drop-down list (for example, Late or Missed).
- Hide all except. Hide all data collection compliance results, except for the compliance selections in the second drop-down list (for example, Late or Missed).
-
Filter by Checklist Compliance
In the Checklist drop-down list, select the filter type:
- Show all. Display all checklist compliance results (for example, Late or Missed).
- Hide all. Hide all checklist compliance results.
- Show all except. Display all checklist compliance results, except for the compliance selections in the second drop-down list (for example, Late or Missed).
- Hide all except. Hide all checklist compliance results, except for the compliance selections in the second drop-down list (for example, Late or Missed).
-
- Select Apply.
-
-
Downloading Tiles
Using this procedure, you will download the contents of the Pareto tile into a Microsoft Excel spreadsheet.
-
In the locked dashboard, locate the Pareto tile.
For more information, please see Locking/Unlocking Dashboards.
- In the Pareto tile, select More and then select Download.
- In the Download dialog box, select Save, and in the Save As dialog box, browse to the desired save location on the computer (for example, the Windows Downloads folder).
-
In Microsoft Excel, open the saved file and examine the contents of the downloaded Pareto tile. Microsoft Excel displays the contents expanded or collapsed as it was in the Pareto tile.
The layout of the Excel spreadsheet will depend on how you configured the View Type of the Pareto tile:
- Graph. If you set the View Type to Graph, Enact downloads the graph image of the Pareto tile.
- Graph & Report. If you set the View Type to Graph & Report, Enact downloads the graph image and report of the Pareto tile.
- Report. If you set the View Type to Report, Enact downloads the report of the Pareto tile.
-
-
Removing Tiles
Using this procedure, you will remove the Pareto tile.
-
In the unlocked dashboard, locate the Pareto tile.
For more information, please see Locking/Unlocking Dashboards.
- In the Pareto tile, select More and then select Remove Tile.
- Select Save.
-


