Managing Stream Analysis Tables
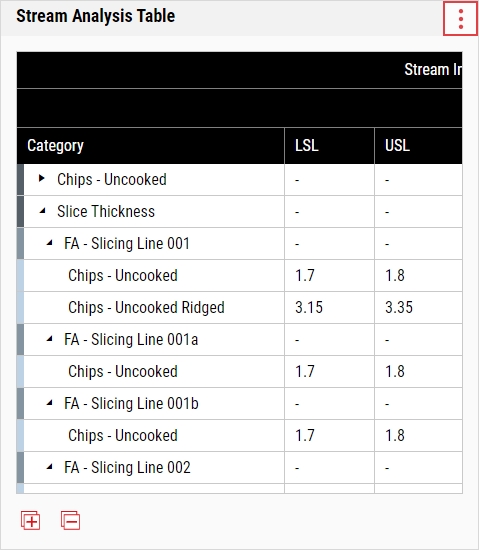
The Stream Analysis Table displays the details about historical data from features (optionally combined with processes and parts), including LSL, USL, subgroup count, yield, Cpk, Cp, and Ppk, as well as other statistics.
When you select the parameter set on the dashboard, it will affect the contents of this tile.
-
In the aggregated dashboard toolbar, select Add Tile and then select the Stream Analysis Table.
-
In the Stream Analysis Table, you can do the following:
- Selecting Parameter Sets
-
 Defining Levels
Using this procedure, you will classify the data into nested categories.
When you add the Stream Analysis Table for the first time, Enact defines the read-only Feature level automatically, and allows you to define the Process and Part levels immediately. When finished, select Apply.
-
In the Stream Analysis Table, select More and then select Define Levels.
-
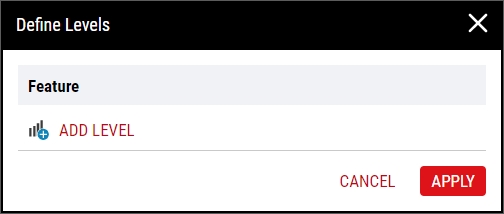
In the Define Levels dialog box, select Add Level.
-
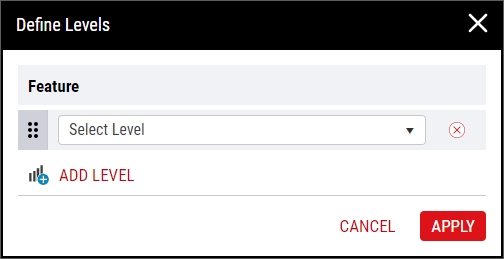
In the Select Level drop-down list, select the desired level type:
- Process. Categorize the data by process type.
- Part. Categorize the data by part.
- To add additional levels, repeat the above steps.
-
To reorder the existing levels (when more than one exists), select and drag Reorder.
Enact will not allow you to reorder the Feature level.
-
To remove an existing level, select Delete.
Enact will not allow you to remove the Feature level.
- When finished, select Apply.
-
-
Expanding Levels
Using this procedure, you will expand the nested levels to show the contents, if any.
To expand all levels, select Expand All.
- In the desired Stream Analysis Table level, select Expand.
- The collapsed level expands.
-
Collapsing Levels
Using this procedure, you will collapse the nested levels to hide the contents, if any.
To collapse all levels, select Collapse All.
- In the desired Stream Analysis Table level, select Collapse.
- The expanded level collapses.
-
Configuring Stream Analysis Table Columns
Using this procedure, you will control the columns that Enact displays on the Stream Analysis Table.
-
In the Stream Analysis Table, select More and then select Configure Columns.
-
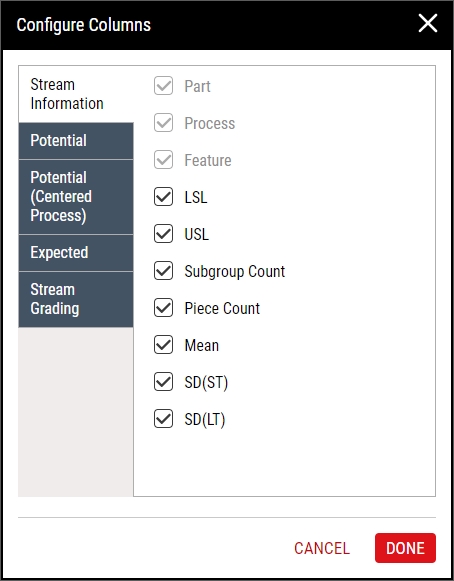
In the Configure Columns dialog box, select the desired tab and then select the desired columns:
-
Stream Information
- LSL. Lower Specification Limit.
- USL. Upper Specification Limit.
- Subgroup Count. Total number of subgroups.
- Piece Count. Total number of measurement values.
-
Mean. Arithmetic average of a given data set, where N represents the number of values in the data set.
Formula -
SD(ST). Short-term process variation estimated from either the within-subgroup standard deviation (for n > 1) or moving standard deviation (for n = 1) of the subgroups.
Formula -
SD (LT). Variation representing the average deviation of values from their mean, often called the RMS (root mean square) method of calculating sigma.
Formula
-
Potential
-
LSL(Z). Lower specification limit expressed in units of short-term standard deviations from the distribution mean. Also known as Z score or Z value. If the lower specification limit is larger than the mean, the LSL(Z) will be a negative number.
Formula -
USL(Z). Upper specification limit expressed in units of short-term standard deviations from the distribution mean. Also known as Z score or Z value. If the upper specification limit is smaller than the mean, the USL(Z) will be a negative number.
Formula - Weighted Fraction < LSL. Projected fraction fallout below Lower Specification Limit. Statistic is weighted based on piece count and short-term standard deviation.
- Weighted Fraction > USL. Projected fraction fallout above Upper Specification Limit. Statistic is weighted based on piece count and short-term standard deviation.
- Fraction < LSL. Projected fraction fallout below Lower Specification Limit based on short-term standard deviation.
- Fraction > USL. Projected fraction fallout above Upper Specification Limit based on short-term standard deviation.
- PDPM. Potential Defects Per Million. Statistic is based on projected fallout on either side of the specification based on short-term standard deviation.
- Yield. Percentage of potential good pieces from total pieces measured based on short-term standard deviation.
- Cpk. 2D Chart. Capability ratio that is adjusted for non-centered processes, using short-term standard deviation, comparing the specification limit spread to the spread of the variation of the data stream. Cpk is equal to the smaller of Cpu or Cpl. Formula

-
-
Potential (Centered Process)
- Spec(Z). Specification limit expressed in units of short-term standard deviations from the distribution mean. Also known as Z score or Z value. Because the process is assumed to be centered, the Spec(Z) will be identical for both the USL and LSL.
- Weighted Fraction OOS. Projected fraction fallout. Statistic is weighted based on piece count and short-term standard deviation.
- Fraction OOS. Projected fraction fallout based on short-term standard deviation.
- PDPM. Potential Defectives Per Million. Statistic is based on projected fallout on either side of the specification and short-term standard deviation.
- Yield. Percentage of potential good pieces from total pieces measured based on short-term standard deviation.
-
Cp. 2D Chart. Capability ratio using short-term standard deviation, comparing the specification limit spread to the spread of the variation of the data stream.
Formula
-
Expected
-
LSL(Z). Lower specification limit expressed in units of long-term standard deviations from the distribution mean. Also known as Z score or Z value. If the lower specification limit is larger than the mean, the LSL(Z) will be a negative number.
Formula -
USL(Z). Upper specification limit expressed in units of long-term standard deviations from the distribution mean. Also known as Z score or Z value. If the upper specification limit is smaller than the mean, the USL(Z) will be a negative number.
Formula - Weighted Fraction < LSL. Projected fraction fallout below Lower Specification Limit. Statistic is weighted based on piece count and long-term standard deviation.
- Weighted Fraction > USL. Projected fraction fallout above Upper Specification Limit. Statistic is weighted based on piece count and long-term standard deviation.
- Fraction < LSL. Projected fraction fallout below Lower Specification Limit based on long-term standard deviation.
- Fraction > USL. Projected fraction fallout above Upper Specification Limit based on long-term standard deviation.
- DPM. Defectives Per Million. Statistic is based on projected fallout on either side of the specification and long-term standard deviation.
- Yield. Percentage of potential good pieces from total pieces measured based on long-term standard deviation.
-
Ppk. 2D Chart. Capability ratio that is adjusted for non-centered processes, using long-term standard deviation, comparing the specification limit spread to the spread of the variation of the data stream. Ppk is equal to the smaller of Ppu or Ppl.
Formula
-
-
Stream Grading
- Grade. A grading rank with nine potential outcomes (A1, A2, A3, B1, B2, B3, C1, C2, C3), with A1 being the best score and C3 being the worst score. The A, B, C portion of the grade relates to the width of the bell curve compared to the specification limits. The 1, 2, 3 portion of the grade relates to how well the process is centered on target. A grade of A1 means that the process is “tight and centered.” A C3 grade indicates a process with undesirable variation and not targeted very well.
- Yield Potential (Centered Process). An indication the best expected yield using short-term standard deviation and a centered process.
- Yield Performance. The ratio of Expected Yield and Yield Potential.
- Expected Yield. An indication of actual yield taking into account off-centeredness and long-term standard deviation.
-
- Select Done.
-
-
Removing Tiles
Using this procedure, you will remove the Stream Analysis Table.
-
In the unlocked dashboard, locate the Stream Analysis Table.
For more information, please see Locking/Unlocking Dashboards.
- In the Stream Analysis Table, select More and then select Remove Tile.
- Select Save.
-
-
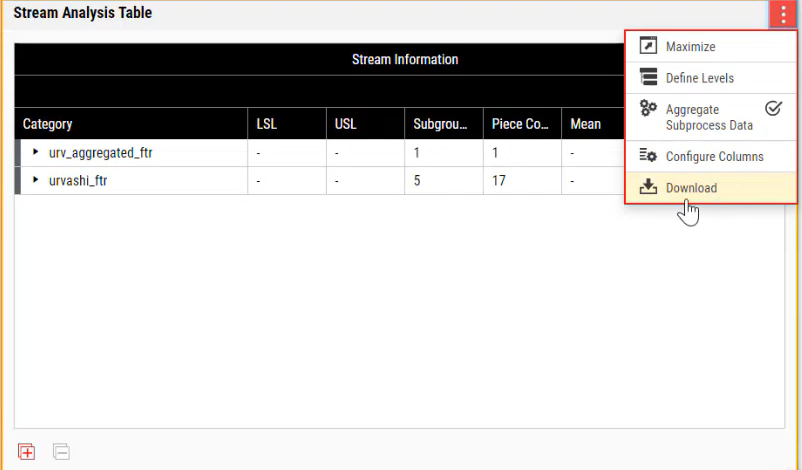
Downloading Stream Analysis Data
Using this procedure, you will download the Stream Analysis Data.
-
Click the red three-dot icon in the right corner of the Stream Analysis table.
-
In the menu, select download.
-
Downloaded data will be automatically exported into an Excel file for viewing.
-


