Managing Data Summary Tiles
The Data Summary tile displays the details about variable features, including count, yield, and when data from the selected levels were last added.
information about variable features, including count, yield, and when data from the selected levels were last added.
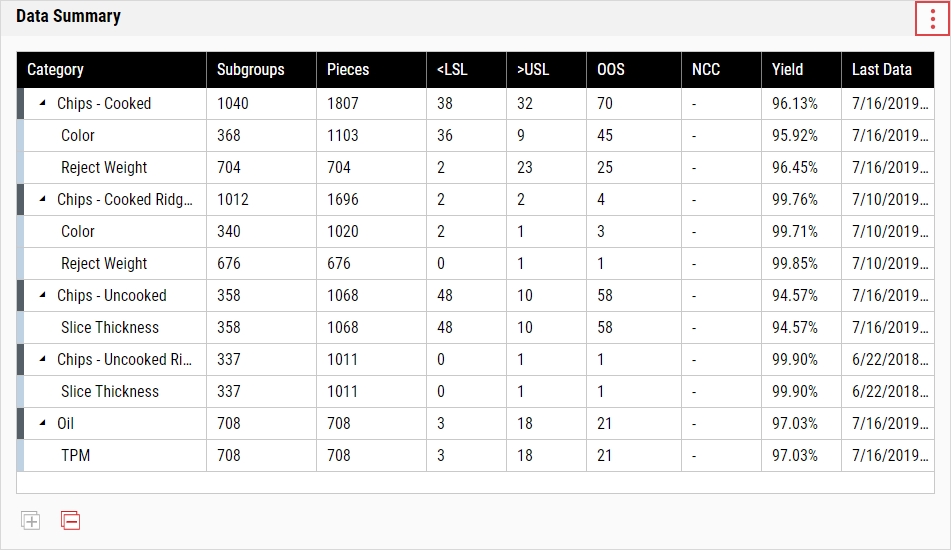
When you select the parameter set on the dashboard, it will affect the contents of this tile.
-
In the raw dashboard toolbar, select Add Tile and then select the Data Summary tile.
-
In the Data Summary tile, you can do the following:
- Selecting Parameter Sets
-
 Defining Levels
Using this procedure, you will classify the data into nested categories, up to a maximum of 10 levels.
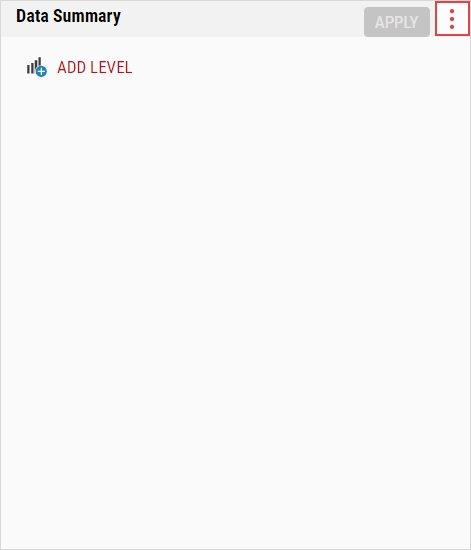
When you add the Data Summary tile for the first time, you must define the levels before doing anything else. Please follow the defining levels instructions below, and then select Apply.
-
In the Data Summary tile, select More and then select Define Levels.
-
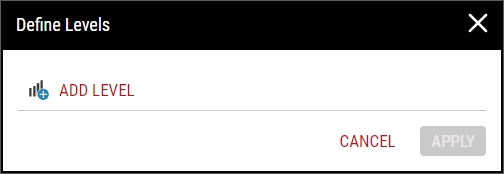
In the Define Levels dialog box, select Add Level.
-
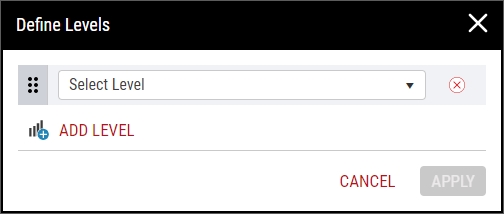
In the Select Level drop-down list, select the desired level type:
- Process. Categorize the data by process.
- Part. Categorize the data by part.
- Feature. Categorize the data by feature.
- Shift. Categorize the data by shift.
- Lot. Categorize the data by lot.
- To add additional levels, repeat the above steps.
- To reorder the existing levels (when more than one exists), select and drag Reorder.
- To remove an existing level, select Delete.
- Select Apply.
-
-
Expanding Levels
Using this procedure, you will expand the nested levels to show the contents, if any.
To expand all levels, select Expand All.
- In the desired Data Summary tile level, select Expand.
- The collapsed level expands.
-
Collapsing Levels
Using this procedure, you will collapse the nested levels to hide the contents, if any.
To collapse all levels, select Collapse All.
- In the desired Data Summary tile level, select Collapse.
- The expanded level collapses.
-
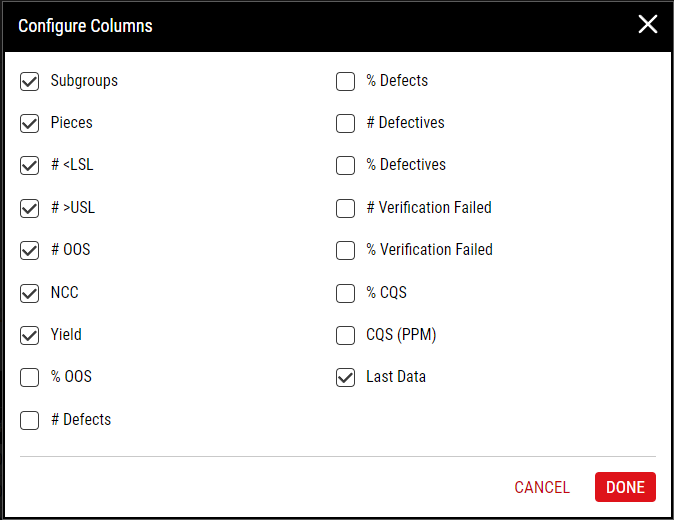
Configuring Columns
Using this procedure, you will control the columns that Enact displays in the Data Summary tile report.
-
In the Data Summary tile, select More and then select Configure Columns.
-
In the Configure Columns dialog box, select the desired columns.
Columns
- <LSL. Number of features that were below the lower specification limit.
- >USL. Number of features that were above the upper specification limit.
- Last Data. Date and time that users added data for this level.
- Pieces. Total number of measurement values.
-
NCC. Number of features exceeding Net Content Control limits.
-
% OOS. Percentage of features that were outside the specification limits.
- # OOS. Number of features that were outside the specification limits.
- Subgroups. Total number of subgroups.
- Yield. Percentage of good pieces from total pieces measured.
- # Defects. Number of defects, weighted by code weight.
- % Defects. Percent of defects.
- # Defectives. Number of defectives, weighted by code weight.
- % Defectives. Percent of defectives.
- # Verification Failed. Number of verification failures.
- % Verification Failed. Percent of verification failures.
- % CQS. (Composite Quality Score) Percent of out-of-specification measured values (total count of out-of-specifications at time of aggregation, regardless of triggered events), defects, and defectives that can be rolled up across any level. A higher CQS indicates worse performance.
- CQS (PPM). (Composite Quality Score) Total out-of-specification measured values (total count of out-of-specifications at time of aggregation, regardless of triggered events), defects, and defectives expressed in terms of parts per million, calculated by the actual total percentage multiplied by a million. A higher CQS indicates worse performance.
- Select Done.
-
-
Downloading Tiles
Using this procedure, you will download the contents of the Data Summary tile into a Microsoft Excel spreadsheet.
-
In the locked dashboard, locate the Data Summary tile.
For more information, please see Locking/Unlocking Dashboards.
- In the Data Summary tile, select More and then select Download.
- In the Download dialog box, select Save, and in the Save As dialog box, browse to the desired save location on the computer (for example, the Windows Downloads folder).
-
In Microsoft Excel, open the saved file and examine the contents of the downloaded Data Summary tile. Microsoft Excel displays the contents expanded or collapsed as it was in the Data Summary tile.
-
-
Removing Tiles
Using this procedure, you will remove the Data Summary tile.
-
In the unlocked dashboard, locate the Data Summary tile.
For more information, please see Locking/Unlocking Dashboards.
- In the Data Summary tile, select More and then select Remove Tile.
- Select Save.
-


