Managing Compliance Summary Tiles
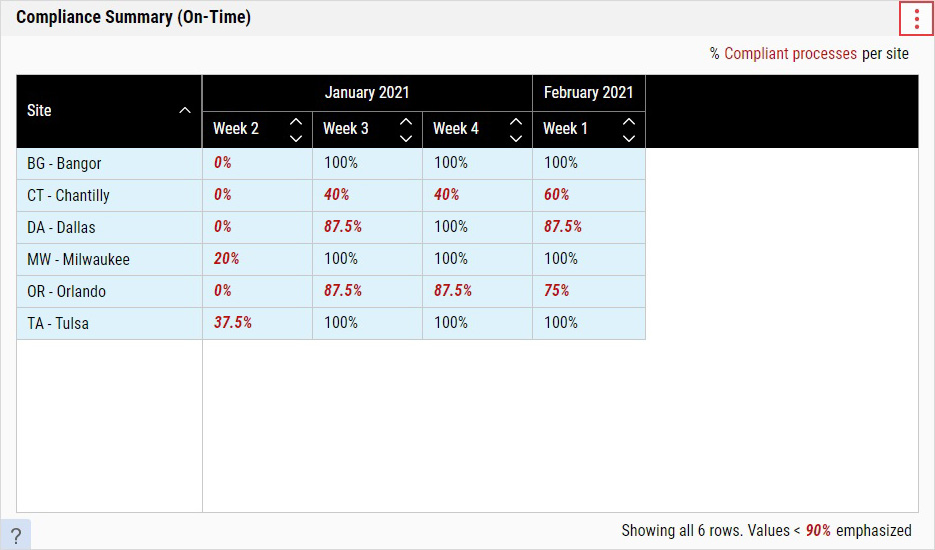
The Compliance Summary tile displays high-level compliance data across sites over time (for time-based parameter sets, by week or by month; for Previous Shift parameter sets, by shift), based on the percentage of processes at a site that meet or exceed a compliance threshold that you define. When configuring the tile, you can hide compliant sites or show all sites and highlight noncompliant sites, allowing you to identify areas that need immediate attention.
When you select the parameter set on the dashboard, it will affect the contents of this tile.
-
In the aggregated dashboard toolbar, select Add Tile and then select the Compliance Summary tile.
-
In the Compliance Summary tile, you can do the following:
- Selecting Parameter Sets
-
 Configuring Options
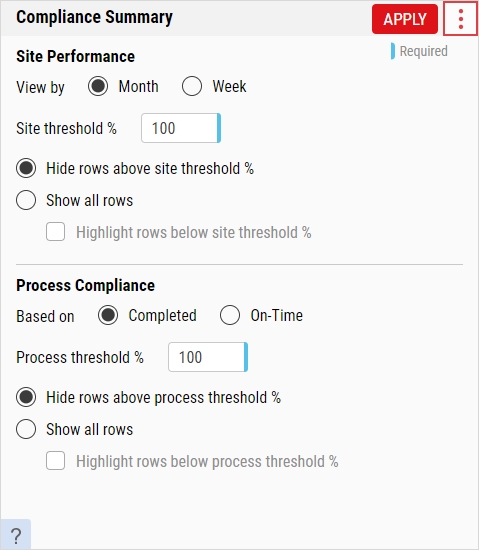
Using this procedure, you will configure your Compliance Summary options.
Enact stores the Compliance Summary options for individual users. If you make changes to the Compliance Summary options and you return later, Enact remembers and displays the changes for you. If another user makes changes to the Compliance Summary options and that user returns later, Enact remembers and displays the changes for that user.
-
In the Site Performance section, you will configure the display of compliant processes at each site, based on a specific percentage threshold. When evaluating percentages, Enact only considers processes with at least one data collection requirement within the established time frame. For example, if the site displays 80% for January, this means that eight out of ten processes were compliant in January.
-
In the View by data field, select the desired monitoring interval (Month or Week).
If the parameter set's Time Window is set to Previous Shift, Enact disables the View by data field, and automatically displays data by previous shift. For more information, please see Creating Parameter Sets.
-
In the Site threshold % data field, type the minimum percent needed for site compliance.
-
To hide compliant site rows, select Hide rows above site threshold %.
-
To display all rows, regardless of compliance, select Show all rows. To highlight non-compliant site rows, select Highlight rows below site threshold %.
-
-
-
In the Process Compliance section, you will configure the display of data collection requirements for each process, based on a specific percentage threshold. When evaluating percentages, Enact considers data collections that were Completed or On-Time, depending on the setting below. For example, if the process compliance threshold is 80% and you completed 85 out of 100 data collections for a process in January, this means that the process in compliant in January.
-
In the Based on data field, select the desired compliance metric:
-
Completed. The data collection requirement was On-Time or Late, and was not Missed.
-
On-Time. The data collection requirement was On-Time only.
-
-
In the Process threshold % data field, type the minimum percent needed for process compliance.
-
To hide compliant process rows, select Hide rows above process threshold %.
-
To display all rows, regardless of compliance, select Show all rows. To highlight non-compliant process rows, select Highlight rows below process threshold %.
-
-
- When finished, select Apply.
-
-
Managing Process Compliance Details
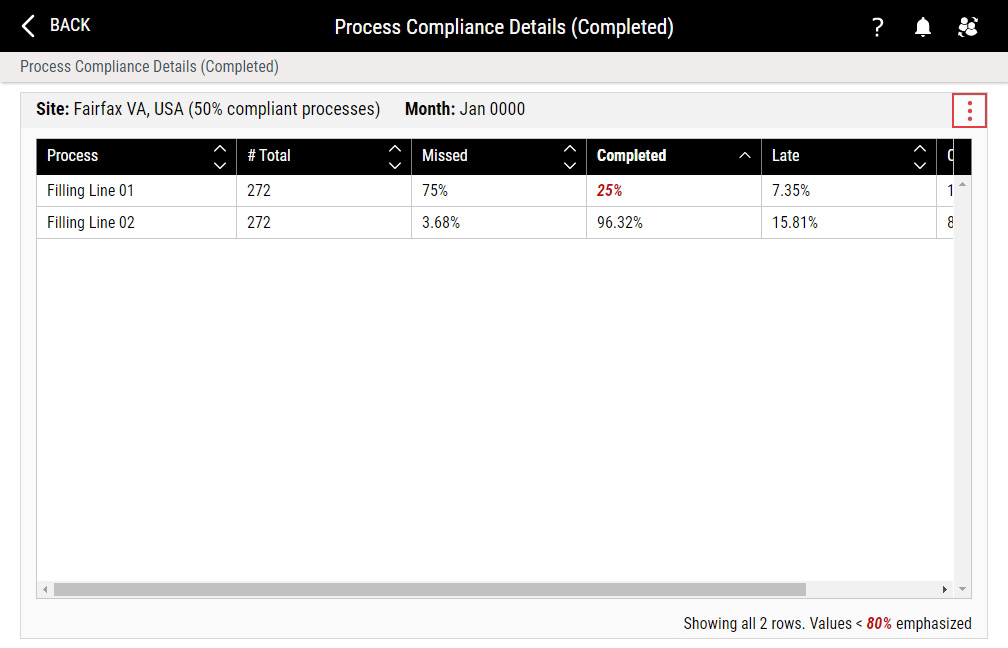
Using this procedure, you can examine the count of data collection requirements and the compliance data for each process (and subprocess) within the selected time interval.
-
In the Compliance Summary tile, select the compliance percentage for the desired process in the desired time frame. For example, in the Fairfax VA, USA site row, select the 50% entry in the January column.
-
Examine the details about the selected site, as follows:
- # Total. Number of available data collections that have been completed or missed.
- Missed. Percentage of data collections that were not completed.
- Completed. Percentage of data collections that were completed on-time or late.
- Late. Percentage of data collections that were completed late.
- On-Time. Percentage of data collections that were completed during the correct interval.
-
To roll up subprocess data (if available), viewing the individual subprocesses, do the following:
- In the Process Compliance Details, select More and then select Aggregate Subprocess Data.
- Locate and expand the parent process for the subprocesses, and then select Subprocesses or the subprocesses counter.
- Select Back.
-
-
Removing Tiles
Using this procedure, you will remove the Compliance Summary tile.
-
In the unlocked dashboard, locate the Compliance Summary tile.
For more information, please see Locking/Unlocking Dashboards.
- In the Compliance Summary tile, select More and then select Remove Tile.
- Select Save.
-


