Managing Box & Whisker Tiles
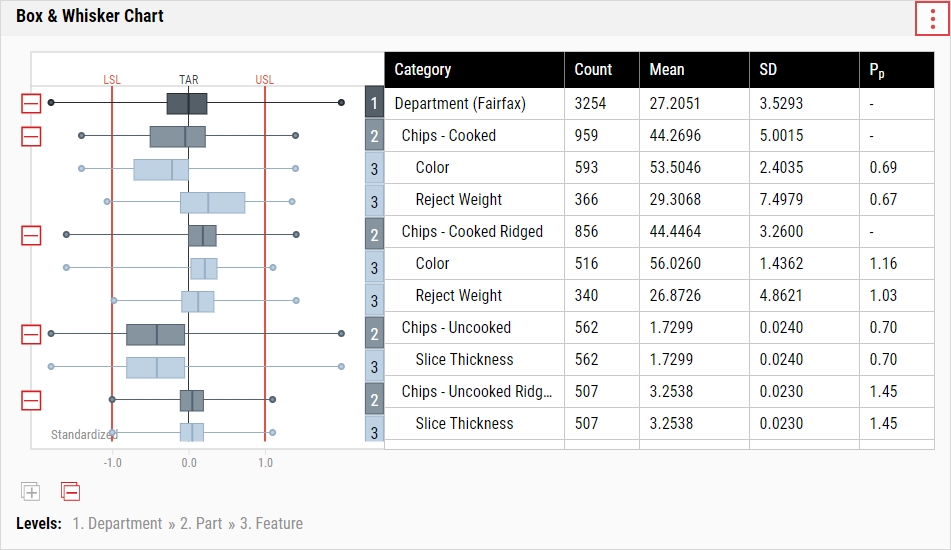
The Box & Whisker tile displays the subgroup sets or data distributions across time, similar to a histogram. However, instead of displaying data in a front view (as you would with a histogram), the Box & Whisker tile displays data in a top view, with three quartiles, the fifth and ninety-fifth percentiles, and the minimum and maximum points, often referred to as outliers.
In the Box & Whisker tile, Enact organizes the selected levels by number and indent, and includes a legend at the bottom to identify the level categories. In order to view this information correctly, you must set your computer's display scaling to 100%. If you do not set your computer's display scaling to 100%, Enact may render the report contents misaligned, and the level numbering will not correspond to the category entry.
The Box & Whisker tile only displays variable data, and will not display defect or defective data.
The most powerful feature of Box & Whisker tiles is the ability to compare performance across multiple categories, such as parts, processes, features, time, etc. But since data from such a wide array of sources can have vastly different targets and tolerances, there needs to be a way to standardize the data to allow for easy comparison.
Enact does this by standardizing all Box & Whisker data to their respective specification limits, with the target coded as a zero, the upper specification limit as a +1, and the lower specification limit as a -1.
This standardization is done on the tile graph for display purposes only. Enact does not modify the original data, which can be seen in the tile report.
When you select the parameter set on the dashboard, it will affect the contents of this tile.
-
In the raw dashboard toolbar, select Add Tile and then select the Box & Whisker tile.
-
In the Box & Whisker tile, you can do the following:
- Selecting Parameter Sets
-
 Defining Levels
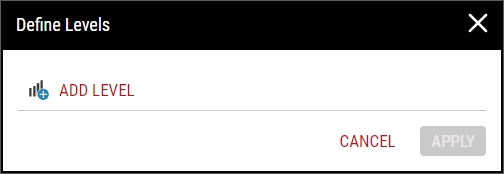
Using this procedure, you will classify the data into nested categories, up to a maximum of 10 levels.
When you add the Box & Whisker tile for the first time, you must define the levels before doing anything else. Please follow the defining levels instructions below, and then select Apply.
-
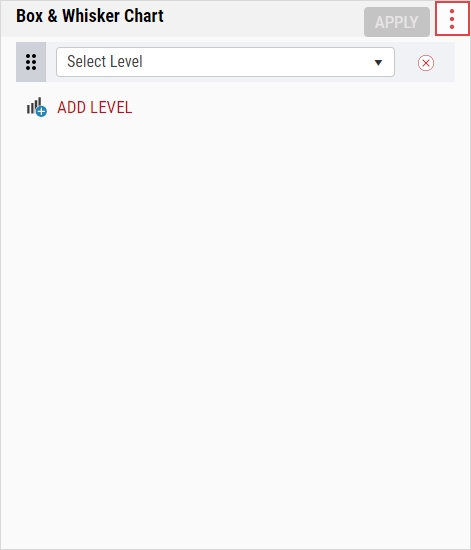
In the Box & Whisker tile, select More and then select Define Levels.
-
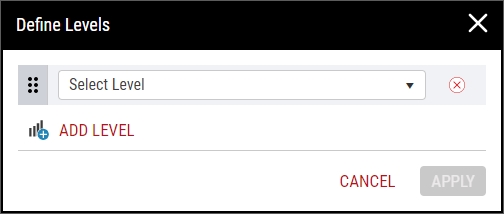
In the Define Levels dialog box, select Add Level.
-
In the Select Level drop-down list, select the desired level type:
- Time. Categorize the data by unit of time.
- Hierarchy. Categorize the data by process type.
- Part. Categorize the data by part (Name) or tag group associated with parts (Tag Group / Tag).
- Feature. Categorize the data by feature (Name) or tags associated with features (Tag Group / Tag).
- Shift. Categorize the data by shift.
- Lot. Categorize the data by lot (Name) or tags associated with lots (Tag Group / Tag).
- Code. Categorize the data by code (Name) or tags associated with codes (Tag Group / Tag).
- To add additional levels, repeat the above steps.
- To reorder the existing levels (when more than one exists), select and drag Reorder.
- To remove an existing level, select Delete.
- Select Apply.
-
-
Expanding Levels
Using this procedure, you will expand the nested levels to show the contents, if any.
To expand all levels, select Expand All.
Graph / Graph & Report View Type
- In the desired Box & Whisker tile level, select Expand.
- The collapsed level expands.
Report View Type
- In the desired Box & Whisker tile level, select Expand.
- The collapsed level expands.
-
Collapsing Levels
Using this procedure, you will collapse the nested levels to hide the contents, if any.
To collapse all levels, select Collapse All.
Graph / Graph & Report View Type
- In the desired Box & Whisker tile level, select Collapse.
- The expanded level collapses.
Report View Type
- In the desired Box & Whisker tile level, select Collapse.
- The expanded level collapses.
-
Viewing Chart Summary
Using this procedure, you will open the summarized data about the Box & Whisker tile.
-
In the Box & Whisker tile, select More and then select Chart Summary.
Alternatively, you can open the Box & Whisker tile summary panel by doing the following:
- Select the Box & Whisker tile.
- In the upper left hand corner of the dashboard, select Chart Summary.
-
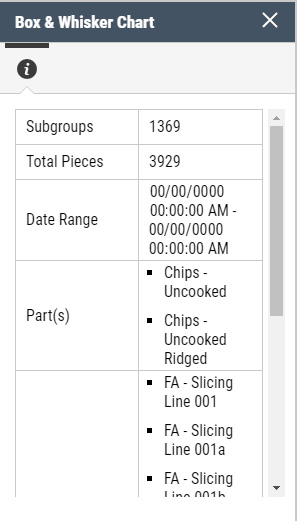
In the Box & Whisker tile summary panel, review the following data about the Box & Whisker tile:
- Subgroups. Subgroup count in the dashboard's selected parameter set.
- Total Pieces. Piece count in the dashboard's selected parameter set.
- Date Range. Start and end date for the collected data in the dashboard's selected parameter set.
- Part(s). Parts in the dashboard's selected parameter set.
- Process(es). Processes in the dashboard's selected parameter set.
- Feature(s). Features in the dashboard's selected parameter set.
- Shift(s). Shifts in the dashboard's selected parameter set.
- Lot(s). Lots in the dashboard's selected parameter set.
If you filter the dashboard's parameter set, Enact automatically updates the data in the Box & Whisker tile summary panel. For more information about filtering the dashboard's parameter set, please see Filtering Dashboard Parameter Sets.
-
-
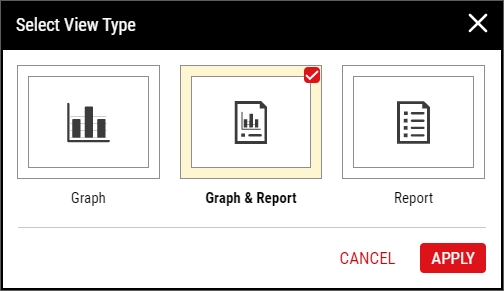
Setting View Type
Using this procedure, you will select the display of the Box & Whisker tile.
-
In the Box & Whisker tile, select More and then select Select View Type.
-
In the Select View Type dialog box, select the desired display of the Box & Whisker tile:
- Graph. Display the Box & Whisker tile graph only.
- Graph & Report. Display the Box & Whisker tile graph and report.
- Report. Display the Box & Whisker tile report only.
- Select Apply.
-
-
Configuring Columns
Using this procedure, you will control the columns that Enact displays in the Box & Whisker tile report.
-
In the Box & Whisker tile, select More and then select Configure Columns.
-
In the Configure Columns dialog box, select the desired columns.
Columns
- % OOS. Percentage of features that were outside the specification limits.
- 5th Percentile. Value of the 5th percentile data point.
- 25th Percentile. Value of the 25th percentile data point.
- 75th Percentile. Value of the 75th percentile data point.
- 95th Percentile. Value of the 95th percentile data point.
- Count. Total number of measurement values.
- LSL. Lowest value in which a given service or product must perform.
- Maximum. Largest value entered for a feature found in the parameter set.
-
Mean. Arithmetic average of a given data set, where N represents the number of values in the data set.
FormulaWhen a sublevel is defined beneath an existing level, the weighted mean (
 ) of the individual sublevel distributions is used to calculate the upper level mean. FormulaStandardizing Data
The most powerful feature of Box & Whisker tiles is the ability to compare performance across multiple categories, such as parts, processes, features, time, etc. But since data from such a wide array of sources can have vastly different targets and tolerances, there needs to be a way to standardize the data to allow for easy comparison.
Enact does this by standardizing all Box & Whisker data to their respective specification limits, with the target coded as a zero, the upper specification limit as a +1, and the lower specification limit as a -1.
This standardization is done on the tile graph for display purposes only. Enact does not modify the original data, which can be seen in the tile report.
- Median. Value of the 50th percentile data point.
- Minimum. Smallest value entered for a feature found in the parameter set.
- # OOS. Number of features that were outside the specification limits.
-
Pp. Ratio of the process variability (six sigma) with the width of the specification limits (total tolerance). The standard deviation (sigma) is calculated using the root mean square method (RMS).
FormulaWhen a sublevel is defined beneath an existing level, the pooled standard deviation (
 ) is used instead of SD(lt).
 -
Ppk. Capability ratio that is adjusted for non-centered processes, using long-term standard deviation, comparing the specification limit spread to the spread of the variation of the data stream. Ppk is equal to the smaller of Ppu or Ppl.
Formula -
Ppl. Difference between the lower specification limit and the process mean, divided by three standard deviations. The standard deviation (sigma) is calculated using the root mean square (RMS) method.
FormulaWhen a sublevel is defined beneath an existing level, the weighted mean (
 ) and pooled standard deviation (
 ) are used instead of
  and SD(lt).
 -
Ppu. Difference between the upper specification limit and the process mean, divided by three standard deviations. The standard deviation (sigma) is calculated using the root mean square method (RMS).
FormulaWhen a sublevel is defined beneath an existing level, the weighted mean (
 ) and pooled standard deviation (
 ) are used instead of
  and SD(lt).
 -
Pr (1/Pp). Inverse of the Pp.
Formula - Range. Difference between the smallest value and the largest value within a subgroup or data set.
- Sigma Level. Equivalent sigma level based upon the % out of specification.
-
Standard Deviation. Variation representing the average deviation of values from their mean, often called sigma because the Greek letter sigma is used as a symbol for standard deviation.
FormulaWhen a sublevel is defined beneath an existing level, the pooled standard deviation (
 ) of the individual sublevel distributions is used to calculate the upper level standard deviation. Formula
 - TAR. Desired process centering.
- USL. Highest value in which a given service or product may perform.
- Select Done.
-
-
Downloading Tiles
Using this procedure, you will download the contents of the Box & Whisker tile into a Microsoft Excel spreadsheet.
-
In the locked dashboard, locate the Box & Whisker tile.
For more information, please see Locking/Unlocking Dashboards.
- In the Box & Whisker tile, select More and then select Download.
- In the Download dialog box, select Save, and in the Save As dialog box, browse to the desired save location on the computer (for example, the Windows Downloads folder).
-
In Microsoft Excel, open the saved file and examine the contents of the downloaded Box & Whisker tile. Microsoft Excel displays the contents expanded or collapsed as it was in the Box & Whisker tile.
The layout of the Excel spreadsheet will depend on how you configured the View Type of the Box & Whisker tile:
- Graph. If you set the View Type to Graph, Enact downloads the graph image of the Box & Whisker tile.
- Graph & Report. If you set the View Type to Graph & Report, Enact downloads the graph image and report of the Box & Whisker tile.
- Report. If you set the View Type to Report, Enact downloads the report of the Box & Whisker tile.
-
-
Removing Tiles
Using this procedure, you will remove the Box & Whisker tile.
-
In the unlocked dashboard, locate the Box & Whisker tile.
For more information, please see Locking/Unlocking Dashboards.
- In the Box & Whisker tile, select More and then select Remove Tile.
- Select Save.
-


