Managing 2D Charts
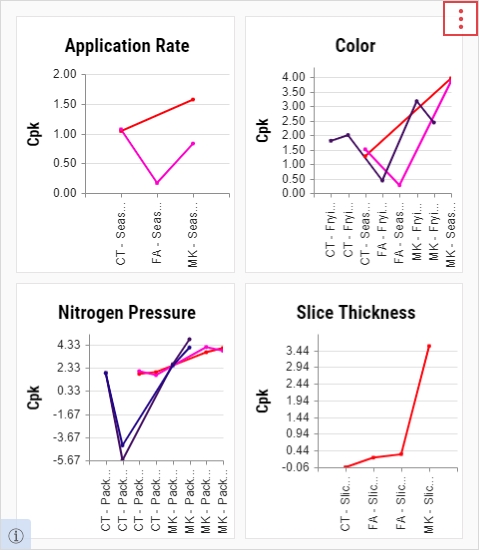
The 2D Chart tile displays the graphical views for a selected statistic of process performance based on historical data from process-feature combinations, including Cpk, Ppk, yield (expected and potential), and mean, among others.
When you select the parameter set on the dashboard, it will affect the contents of this tile.
-
In the aggregated dashboard toolbar, select Add Tile and then select the 2D Chart tile.
-
In the 2D Chart tile, you can do the following:
- Selecting Parameter Sets
-
 Displaying Statistic
Using this procedure, you will select the statistic displayed in the 2D Chart tile.
-
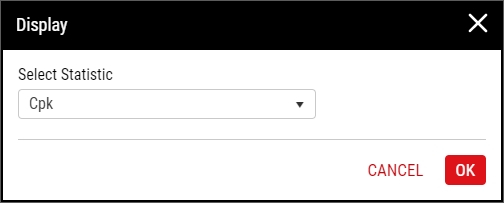
In the 2D Chart tile, select More and then select Display.
-
In the Select Statistic drop-down list, select the desired statistic.
Available Statistics
-
Cpk. Capability ratio that is adjusted for non-centered processes, using short-term standard deviation, comparing the specification limit spread to the spread of the variation of the data stream. Cpk is equal to the smaller of Cpu or Cpl.
Formula -
Ppk. Capability ratio that is adjusted for non-centered processes, using long-term standard deviation, comparing the specification limit spread to the spread of the variation of the data stream. Ppk is equal to the smaller of Ppu or Ppl.
Formula -
Robustness. Ratio of short term to long term standard deviation, expressed as a percent. The closer this percent is to 100, the more stable the process is over time.
Formula -
Cp. Capability ratio using short-term standard deviation, comparing the specification limit spread to the spread of the variation of the data stream.
Formula -
Pp. Ratio of the process variability (six sigma) with the width of the specification limits (total tolerance). The standard deviation (sigma) is calculated using the root mean square method (RMS).
Formula - Yield (Expected). Percentage of expected good pieces from total pieces measured.
- Yield (Potential). Percentage of potential good pieces from total pieces measured.
-
Give Away %. Percentage of weight, volume, or count that was overfilled to ensure compliance.
Formula -
Mean. Arithmetic average of a given data set, where N represents the number of values in the data set.
Formula -
SD (ST). Short-term process variation estimated from either the within-subgroup standard deviation (for n > 1) or moving standard deviation (for n = 1) of the subgroups.
Formula -
SD (LT). Variation representing the average deviation of values from their mean, often called the RMS (root mean square) method of calculating sigma.
Formula -
Overfill LSC. Difference between Mean and Label Stated Content.
Formula - Specification Events. Number of specification limit violation events.
-
- To display the lot in the 2D sub tile, select Display Lot.
- Select OK.
-
-
Removing Tiles
Using this procedure, you will remove the 2D Chart.
-
In the unlocked dashboard, locate the 2D Chart.
For more information, please see Locking/Unlocking Dashboards.
- In the 2D Chart, select More and then select Remove Tile.
- Select Save.
-


