Statistical Rules
Statistical rules are real-time triggers used to warn when a special cause of variation has occurred.
Enact automatically updates statistical rules every 10 minutes, which means there will be a slight delay before you see recent changes.
The default rules are:
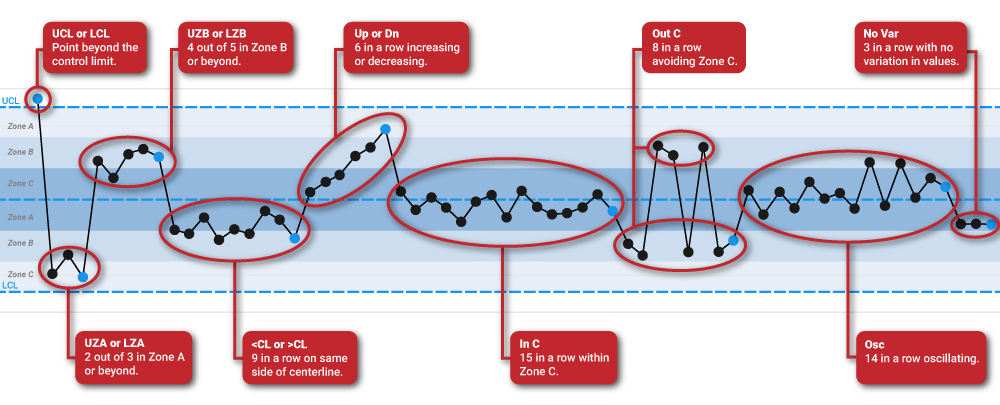
- Above upper control limit. Number of hits out of a specific number of subgroups that trigger a control limit violation when above the Upper Control Limit.
- Below lower control limit. Number of hits out of a specific number of subgroups that trigger a control limit violation when below the Lower Control Limit.
- In or above upper zone A. Number of hits out of a specific number of successive points that fall in or beyond Zone A on the upper side of the mean.
- In or below lower zone A. Number of hits out of a specific number of successive points that fall in or beyond Zone A on the lower side of the mean.
- In or above upper zone B. Number of hits out of a specific number of successive points that fall in or beyond Zone B on the upper side of the mean.
- In or below lower zone B. Number of hits out of a specific number of successive points that fall in or beyond Zone B on the lower side of the mean.
- Run above centerline. Number of hits out of a specific number of successive points that fall above the center line.
- Run below centerline. Number of hits out of a specific number of successive points that fall below the center line.
- Run within zone C. Number of hits out of a specific number of successive points that fall in Zone C on either side of the mean.
- Avoidance of zone C. Number of hits out of a specific number of successive points that fall outside of Zone C.
- Consecutive points rising. Number of hits out of a specific number of successive points that are rising upwards.
- Consecutive points falling. Number of hits out of a specific number of successive points that are decreasing downwards.
- Oscillating up and down. Number of hits out of a specific number of successive points that produce a rhythmic and predictable variation between the upper and lower area of the mean causing an unusual or nonrandom pattern in the data.
- No variation in values. Number of hits out of a specific number of successive points that shows no variation.